1. Tier 1 IDS/IPS Device Configurations
There are a variety of IDS/IPS applications that interface to HAWK applications to enhance the information available. The following section provides detailed information for installing and configuring each of the IDS/IPS devices for Tier 1 configurations.
1.1. HAWK Snort IDS/IPS CentOS Installation Package
Snort ® is an open source network intrusion IDS/IPS system created by Soucefire which combines signature protocol, and anomaly-based inspection to identify and report intrusions. It is one of the most popular intrusion detection packages on the market and seamlessly integrates into the HAWK SIEM Suite. The following provides instruction for installing the Snort IDS/IPS CentOS installation package.
Download the HAWK Snort IDS/IPA Centos Installation package and extract it.
user@host:# tar xfzv hawk-snort-install-0.5-CentOS_RHEL-5.5tar.gz
user@host:# cd hawk-snort-install; chmod 755 install uninstall
user@host:# ./install –h
Usage: ./install [-m] [-i]
Execute the installer and continue the installation process:
user@host:# ./install –i
[*] Cleaning up RHEL/CentOS Server:
Cleaning up after initial installation process... done.
Updating our yum database... done.
Re-configuring SSH to listen on non-standard port... done.
Select SNORT Installation type, a) snort b) snort-inline: a
Installing SNORT services... done.
Downloading SNORT rules from the web: ...
Installing SNORT rules... done.
Installing SNORT configuration... done.
Installing SNORT Barnyard2... done.
Installing SNORT Barnyard configuration... Running in Rule Dump mode
--== Initializing Snort ==--
Initializing Output Plugins!
Initializing Preprocessors!
Initializing Plug-ins!
Parsing Rules file "/etc/snort/snort.conf"
...
PortVar 'SHELLCODE_PORTS' defined : [ 0:79 81:65535 ]
PortVar 'ORACLE_PORTS' defined : [ 1024:65535 ]
PortVar 'SSH_PORTS' defined : [ 22 ]
Detection:
Search-Method = AC-Full-Q
Split Any/Any group = enabled
Search-Method-Optimizations = enabled
Maximum pattern length = 20
done.
Securing system... done.
Now configuring system security to allow services:
/usr/sbin/setenforce: SELinux is disabled
1.2. Snort IDS/IPS Barnyard/Barnyard2 Output Configuration
The next step is to download the HAWK Barnyard-0.2 source code and compile it on the local system. Since HAWK does not distribute binary builds, the customer is responsible for obtaining the compiling tools to complete the installation.
For Snort/Barnyard-0.2, follow these instructions:
Create the install.
user@host:# tar xfzv barnyard-0.2.0-hawk.tar.gz
user@host:# cd barnyard-0.2.0-hawk
user@host:# ./configure; make; make install
Configure the barnyard configuration file to use the HAWK syslog output plugin.
# Available as both a log and alert output plugin. Used to output data via TCP/UDP
# HAWK Network Defense, Inc.
# Arguments:
#
sensor_name $sensor_name - unique sensor name
#
server $server - server the device will report to
#
protocol $protocol - protocol device will report over (tcp/udp)
#
port $port - destination port device will report to (default: 514)
#
detail $detail_threshold - specify full/complete log reporting or only summaries.
#output alert_syslog_full: sensor_name snortIds1-eth2, server target.host.com,
protocol udp, port 514, detail full
#output log_syslog_full: sensor_name snortIds1-eth2, server target.host.com, protocol tcp
Barnyard2-1.9 supports full payload forwarding based on the code in the custom Barnyard2-1.8, version. An example configuration option for the new Snort/Barnyard-1.9, is as follows:
enable daemon modeconfig daemon#config localtimeconfig reference_file: /snort/etc/reference.configconfig classification_file: /snort/etc/classification.configconfig gen_file: /snort/etc/gen-msg.mapconfig sid_file: /snort/etc/sid-msg.mapconfig hostname: 1.2.3.4config interface: eth1input unified2output log_syslog_full: sensor_name 1.2.3.4-eth1, server 10.10.10.100, operation_mode complete, detail full
For the old Custom Barnyard2-1.9, the following commands are used to download and compile the Barnyard2-1/.9:
Create the install.
user@host:# ./configure --enable-syslog_full; make; make install
Configure the Barnyward2 configuration file to utilize the HAWK syslog output plugin:
# Full log data
output syslog_full_log: host=my.remote.host:514, DETAIL_FULL LOG_AUTH LOG_INFO
# Summarized alert data
output syslog_full_alert: host=my.remote.host:514, DETAIL_FULL LOG_AUTH LOG_INFO
# More Examples:
output syslog_full_alert: LOG_AUTH LOG_ALERT
output syslog_full_alert: host=hostname, LOG_AUTH LOG_ALERT
output syslog_full_alert: host=hostname:port, LOG_AUTH LOG_ALERT
output syslog_full_alert: host=hostname:port, DETAIL_FULL LOG_AUTH
output syslog_full_log: LOG_AUTH LOG_ALERT
output syslog_full_log: host=hostname, LOG_AUTH LOG_ALERT
output syslog_full_log: host=hostname:port, LOG_AUTH LOG_ALERT
output syslog_full_log: host=hostname:port, DETAIL_FULL LOG_AUTH LOG_ALERT
output syslog_full_log: host=hostname:port, SYSLOG_FULL_PROTO_UDP DETAIL_FAST
output syslog_full_log: host=hostname:port, SYSLOG_FULL_PROTO_TCP DETAIL_FAST
LOG_ALERT
1.3. HAWK eyeCon/Sourcefire Defense Center eStream API
Sourcefire uses a threat-centric approach to security which focuses on protecting the site from intrusion before, during, and after the threat. It’s designed to protect against dynamic and sophisticated threats since these threats are targeted and persistent The HAWK eyeCon Sourefire eStream output plugin provides seamless integration with the Sourcefire Defense enter. The following steps provide instructions for installation:
On the engine that is responsible for gathering information, enter the following commands:
user@host:# yum -y install hawk-ece-plugin-perl hawk-ece-plugin-sourcefire
user@host:# service hawk-ece restart
When the restart completes, go to the HAWK Web portal, and on the navigation panel, click on
In the Resource Administration section, Click on the button.
Enter the Host name of the Resource.
Enter the IPv4 Network IP address for the Resource.
Enter the IPv6 Network IP address for the Resource (optional).
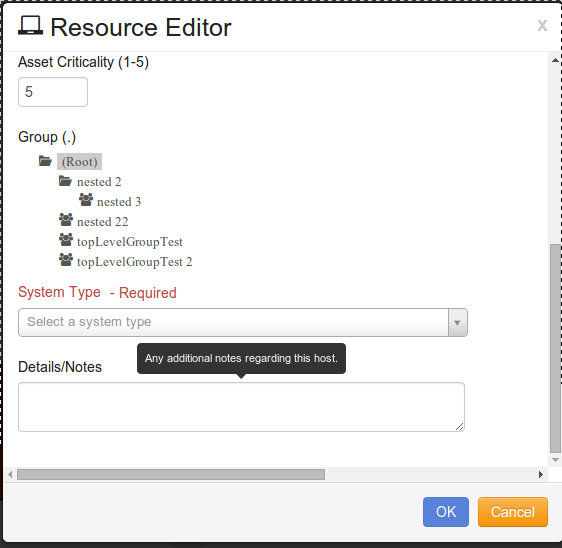
If the Resource is designated as a Compliance Asset, Click on the radio button by “True”, if the Resource is not designated as a Compliance Asset, Click on the Radio button next to “False”.
Enter the Critical value for the Asset. There are five levels which identify the criticality of the asset, which are:
Level 1 - Critical/Sensitive Data (Highly sensitive and critical data)
Level 2 - High (very important data)
Level 3 - Moderate
Level 4 - Low
Level 5 - Very Low
Select the specific Group to which the new Resource is assigned.
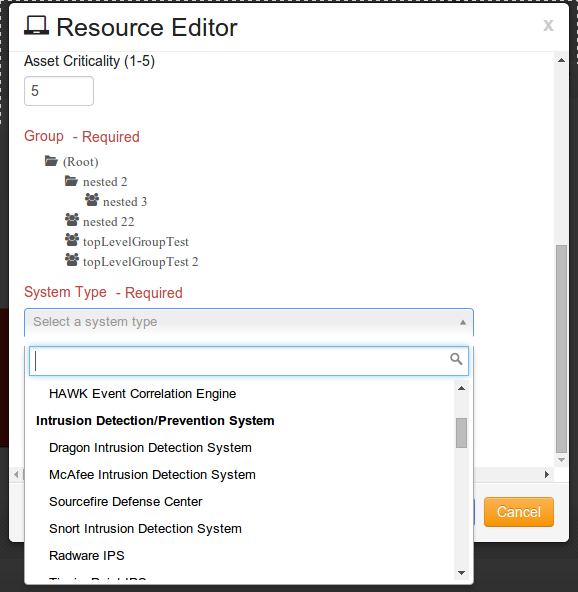
At System Type, click on the drop-down arrow and Select “Sourcefire Defense Center”.
Enter additional detailed notes in the Details/Notes section.
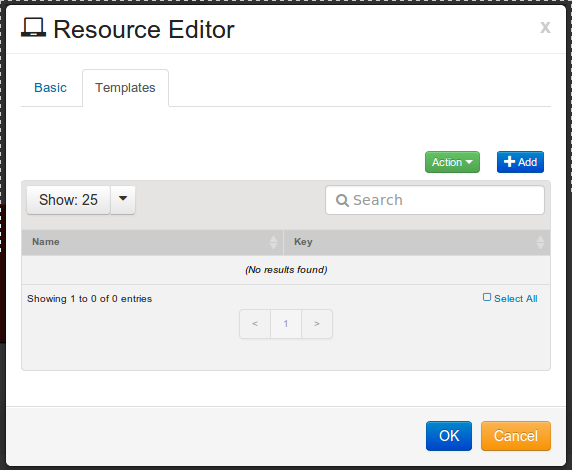
Click on tab.
Click on the button.
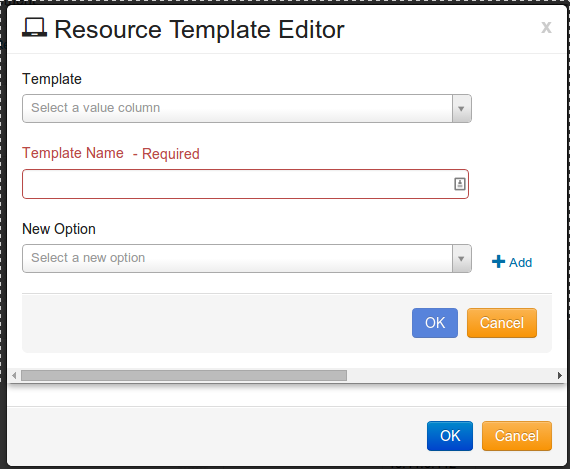
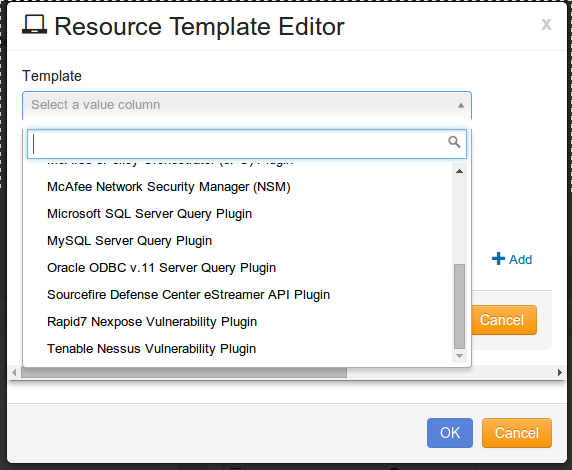
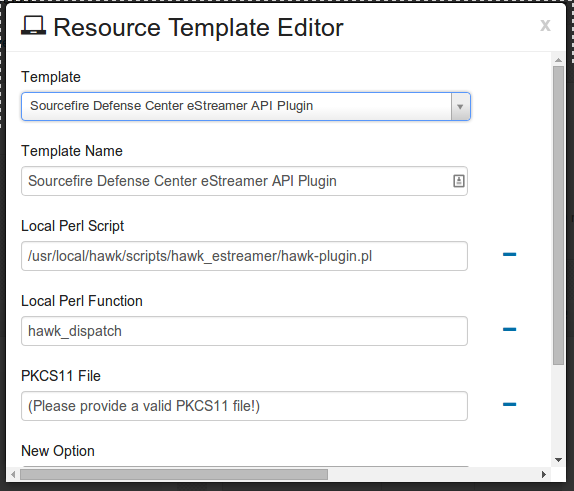
Resource Template Editor will open, as shown:
Click the drop-down arrow for Template, and select “Sourcefire Defense Center eStreamer API Plugin”.
Local Perl Script, and Local Perl Function will auto populate with the correct information. You need to provide a valid PKCS11 file location.
Once finished click button to save your Resource template.
Click button again to save your resource.
Verify that its showing in the Resource Administration Table.
Note
In order for the Data Tier to decrypt and store the information correctly. Check hcpulse.cfg file on engines that are responsible for processing this Pulse Template. Insure hcpulse.cfg has the correct HTTPCredentialSecret value. It should match the “ENCRYPTION_KEY_PLAIN” in config.php located at ‘/var/www/hawk-data/htdocs/API/1.1/config.php’ on the hawk-data (API) server.
1.4. HAWK eyeCon/Juniper IDS/IPS Device Configuration
For customers utilizing the Juniper IDS/IPS devices that are supported include:
Juniper SRX Devices
Juniper Networks IDP Devices
There are several steps required for configuring to send Syslog Messages from the SRX devices using J-Web, and are shown below:
Login to the Juniper SRX device.
Click on Configuration.
Click on View and Edit.
Click on Edit Configuration in the Juniper SRX device.
Select System and Click EDIT.
Select Syslog and click EDIT.
Select Host and click ADD NEW ENTRY.
Enter the IP address of the remote Syslog Server, i.e., the Firewall Analyzer.
Click APPLY to save the changes.
If the device uses CLI, the following steps are taken:
Log into the Juniper SRX device CLI console.
Execute the following command:
user@host# set system syslog host <IP address of remote Syslog server> any any
1.5. HAWK eyeCon/TippingPoint IDS/IPS Device Configuration
For clients using TippingPoint IPS, the configuration must be modified for HAWK to gather the log files.
The first step is to configure the Audit logs to route them to a Syslog server by using the following steps:
The first step is to open a Browser and enter the following URL address: https://IP_address_of_the_TippingPoint_device
The next step is to enter the administrator login credentials for username and password and click LOG ON.
The System Summary hostname window opens.
Click System in the left pane of the System Summary – hostname window.
Expand the Configuration tab.
Click Syslog Servers.
The Syslog Settings window opens.
In the Audit Log option, select “Enable syslog offload”.
Enter the IP address of the Syslog server in the IP address field.
Click APPLY.
This completes the configuration of the Audit log. The next step is to configure the traffic logs. The Traffic logs consist of:
Alert logs
Block logs
The following steps are used to configure the Traffic logs:
Open a browser and enter the following URL address: https://IP_address_of_the_TippingPoint_device
Enter the administrator log in credentials for username and password, and click on LOG ON.
The System Summary – hostname window opens.
In the left pane of the System Summary, click on IPS and click on Action sets.
Notice that the available Action Sets are shown in the right pane.
Configure each action set by performing the following steps:
In the Action Set column, click on an action set.
In the Contacts table’s Contact Name column, select the Remote System Log option.
Enter the IP address of the HAWK Event Correlation Engine in the IP address field.
Click Add to the table below.
Click Apply I the Remote Syslog Information window.
Under IPS in the left pane, click Action Sets.
Click on the Edit icon that was configured from the Function column of the list of Action sets.
Select the Remote System Log option.
Click on SAVE.
This completes the configuration of the Traffic logs for the TippingPoint and HAWK configuration.
1.6. HAWK eyeCon/Fortinet FortiGate Analyzer IDS/IPS Device
Configuration The following steps must be completed in order to send the logs to the syslog server:
Go to Log and Report.
Select Log Config.
Select Log Setting.
Click on the checkbox next to Syslog.
Enter the following information in the Syslog options:
IP/FDQN - Enter the domain name or the IP address of the syslog server
Port Number - Enter the port number to be used for communication with the Syslog server.
Minimum log level - Select a log level to identify severity level to be used.
Facility – Indicates the source of the log message. By default, FortiGate identifies local7 as the facility, but it can be changed in order to distinguish log message from other Fortinet units.
Enable CSV Format – This produces a log in a comma delimited file; otherwise, plain text files are generated.
When all fields are entered, click on Apply.
Note
The default port number is 514.
1.7. HAWK eyeCon/Enterasys Dragon Remote Syslog Configuration
For the HAWK eyeCon system to monitor the logs from the Enterasys, the system has to be configured. The following steps are performed to configure the system.
Log into the Enterasys DPM or EFP.
Click on Alarmtool.
In the left menu, click on Notification Rules.
In the right menu, select Syslog. If Syslog does not appear, it needs to be created by following these steps: A. Click on New Notification Rules and select Syslog. B. Enter the Facility and make sure the localn selected is not used by the syslog daemon. C. Select Debug at Level. D. For Message, ensure that it’s in the following format:
%TIME% %DATE% SigName=%NAME% from Sensor=%SENSOR% SrcIP=%SIP%DstIP=%DIP% SrcPort=%SPORT% DstPort=%DPORT% Protocol=%PROTO%Click on Save.
1.8. HAWK eyeCon/Barracuda Networks Spam Firewall Remote Syslog Configuration
Before the Barracuda spam and Virus Firewall can be used, the Mail syslog has to be configured by following these steps:
Navigate to Advanced.
Select the Advanced Networking page.
Enter the IP address of the syslog server where the data related to the mail flow should be sent.
Syslog data is the same information as that used to build the Message Log in the Barracuda Spam and Virus Firewall. It includes assorted data such as the connecting IP Address, envelope ‘From’ address, envelope ‘To’ address, and the spam score for the messages transmitted. This syslog data appears on the mail facility at the debug priority level on the specified syslog server.
As the Barracuda Spam and Virus Firewall uses the syslog messages internally for its own message logging, it is not possible to change the facility or the priority level. See the Syslog section of the ADVANCED and select the Troubleshooting page in the Barracuda Spam and Virus Firewall Web interface to open a window and view the Mail syslog output.
