4. Working with Reports
There are a wide variety of Reports which can be created with the data stored. This section discusses these reports and provides the steps for the assorted activities that can be accomplished on the Reports.
4.1. Viewing the Reports Dashboard
To open the Reports Dashboard, and work with the Dashboard, follow these steps:
On the navigation panel, click on .
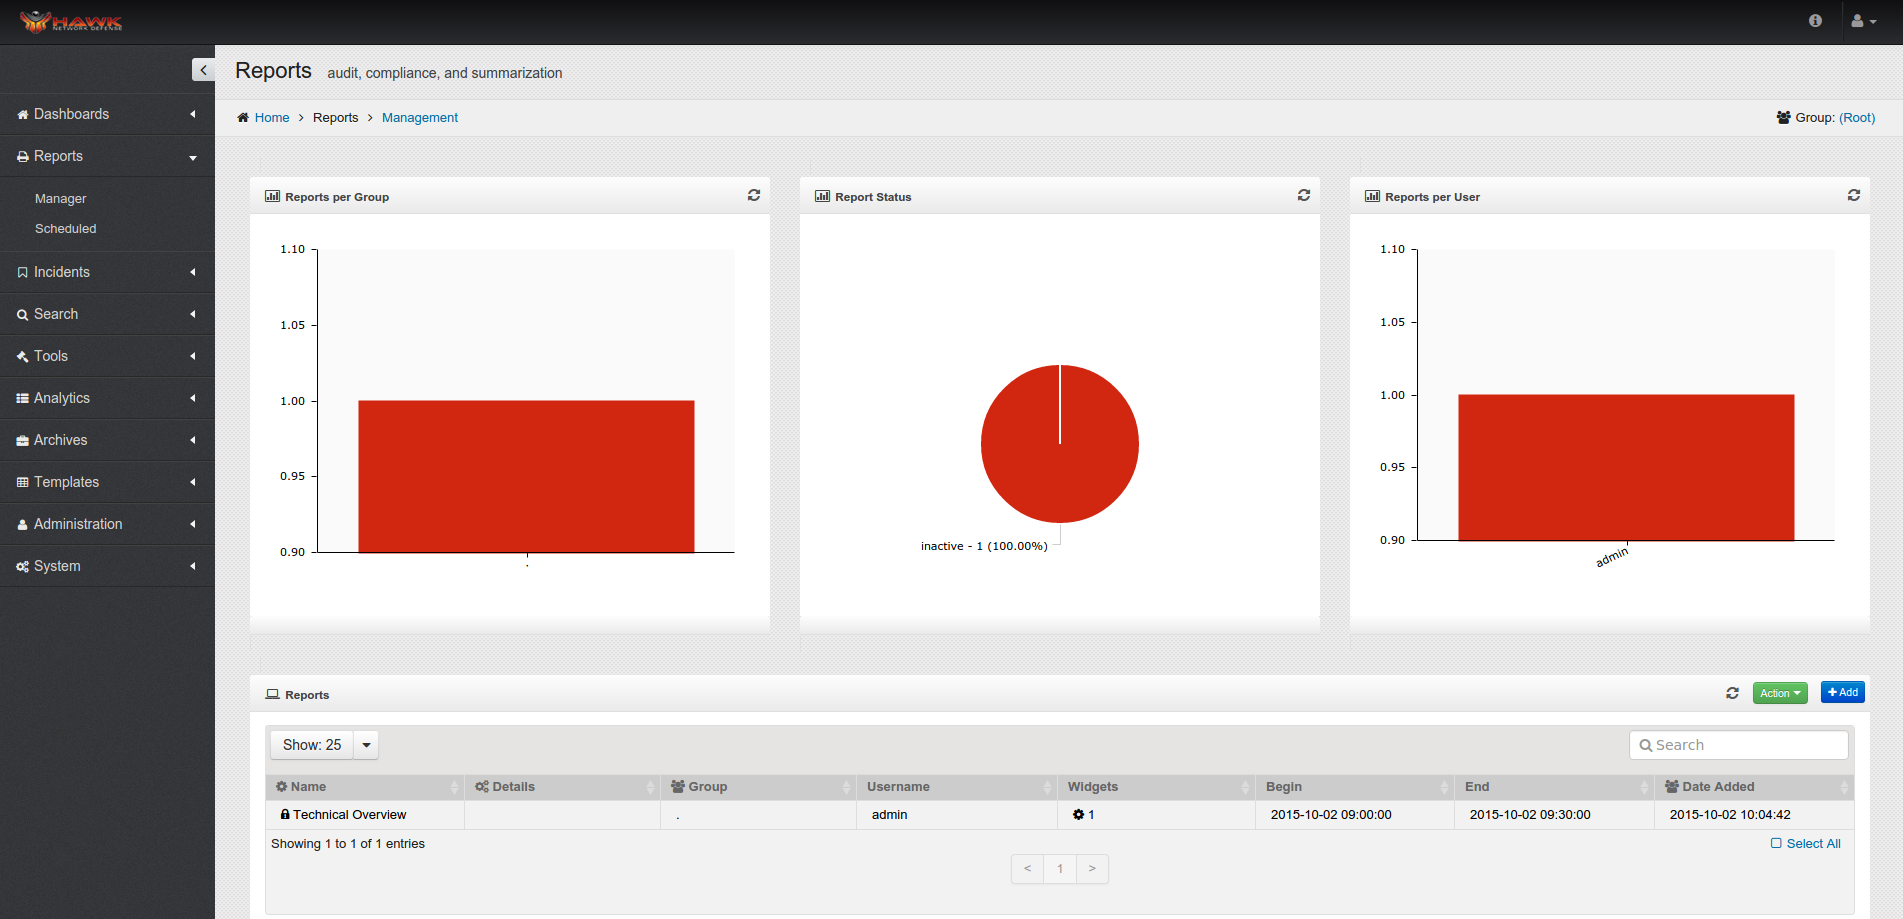
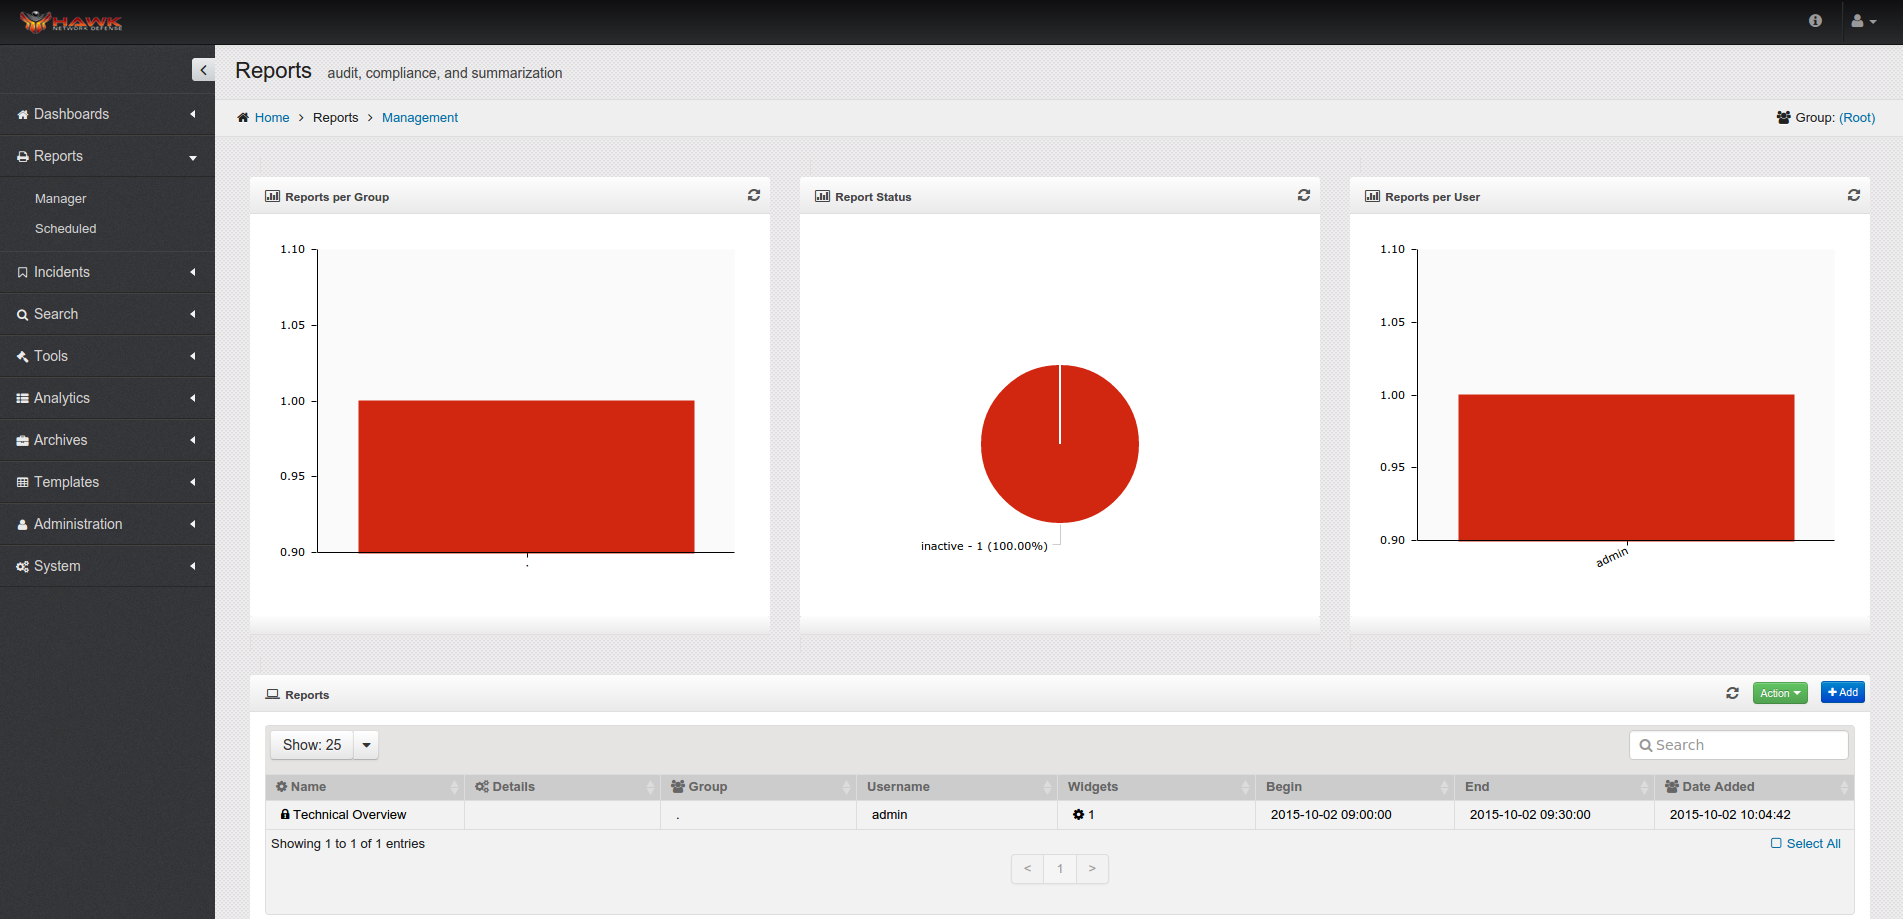
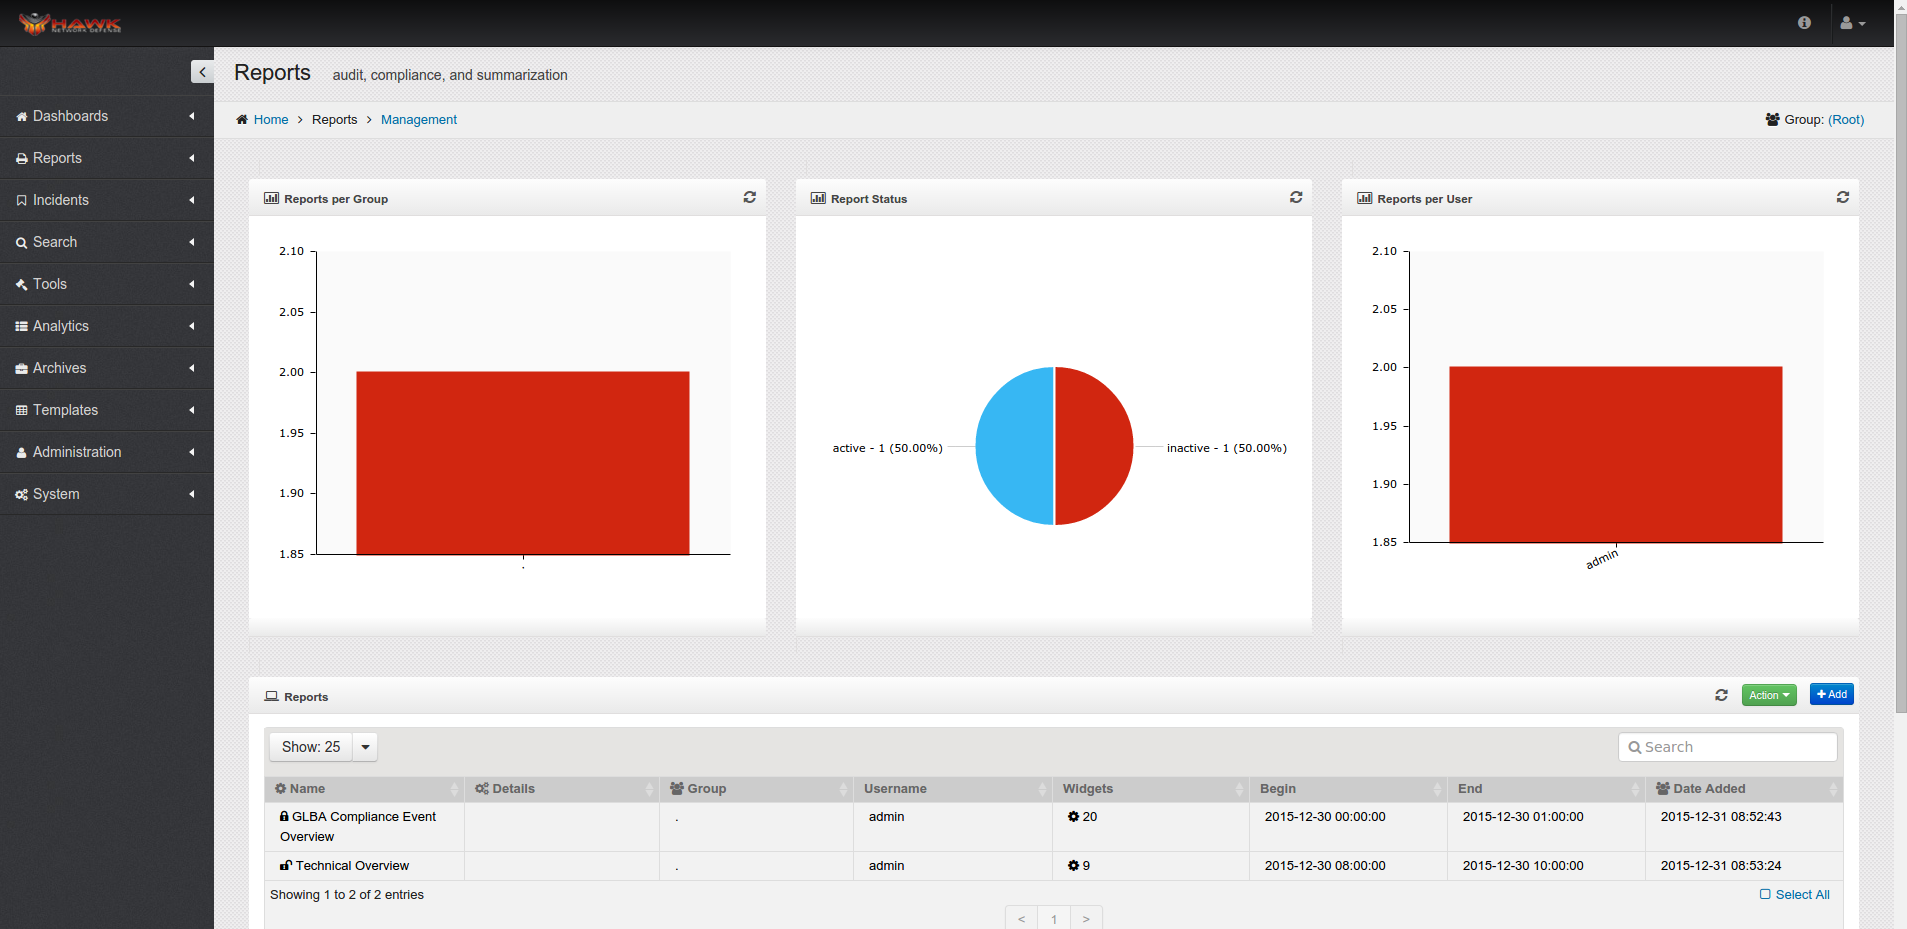
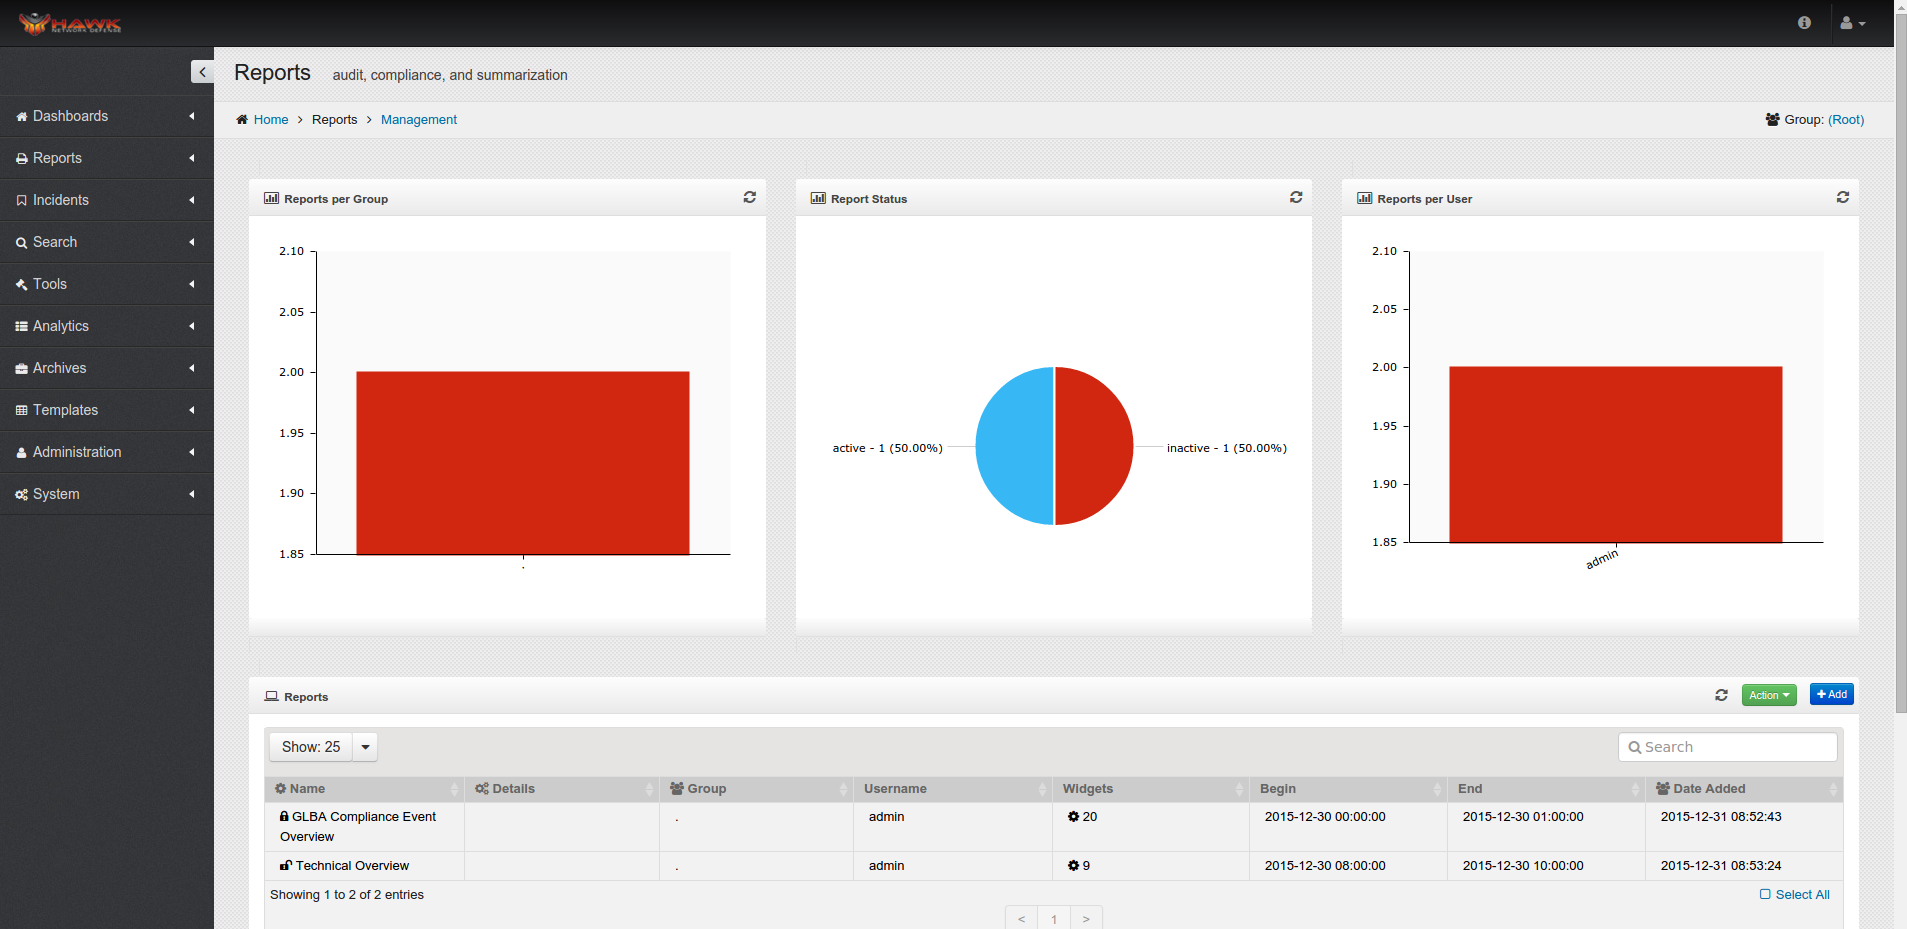
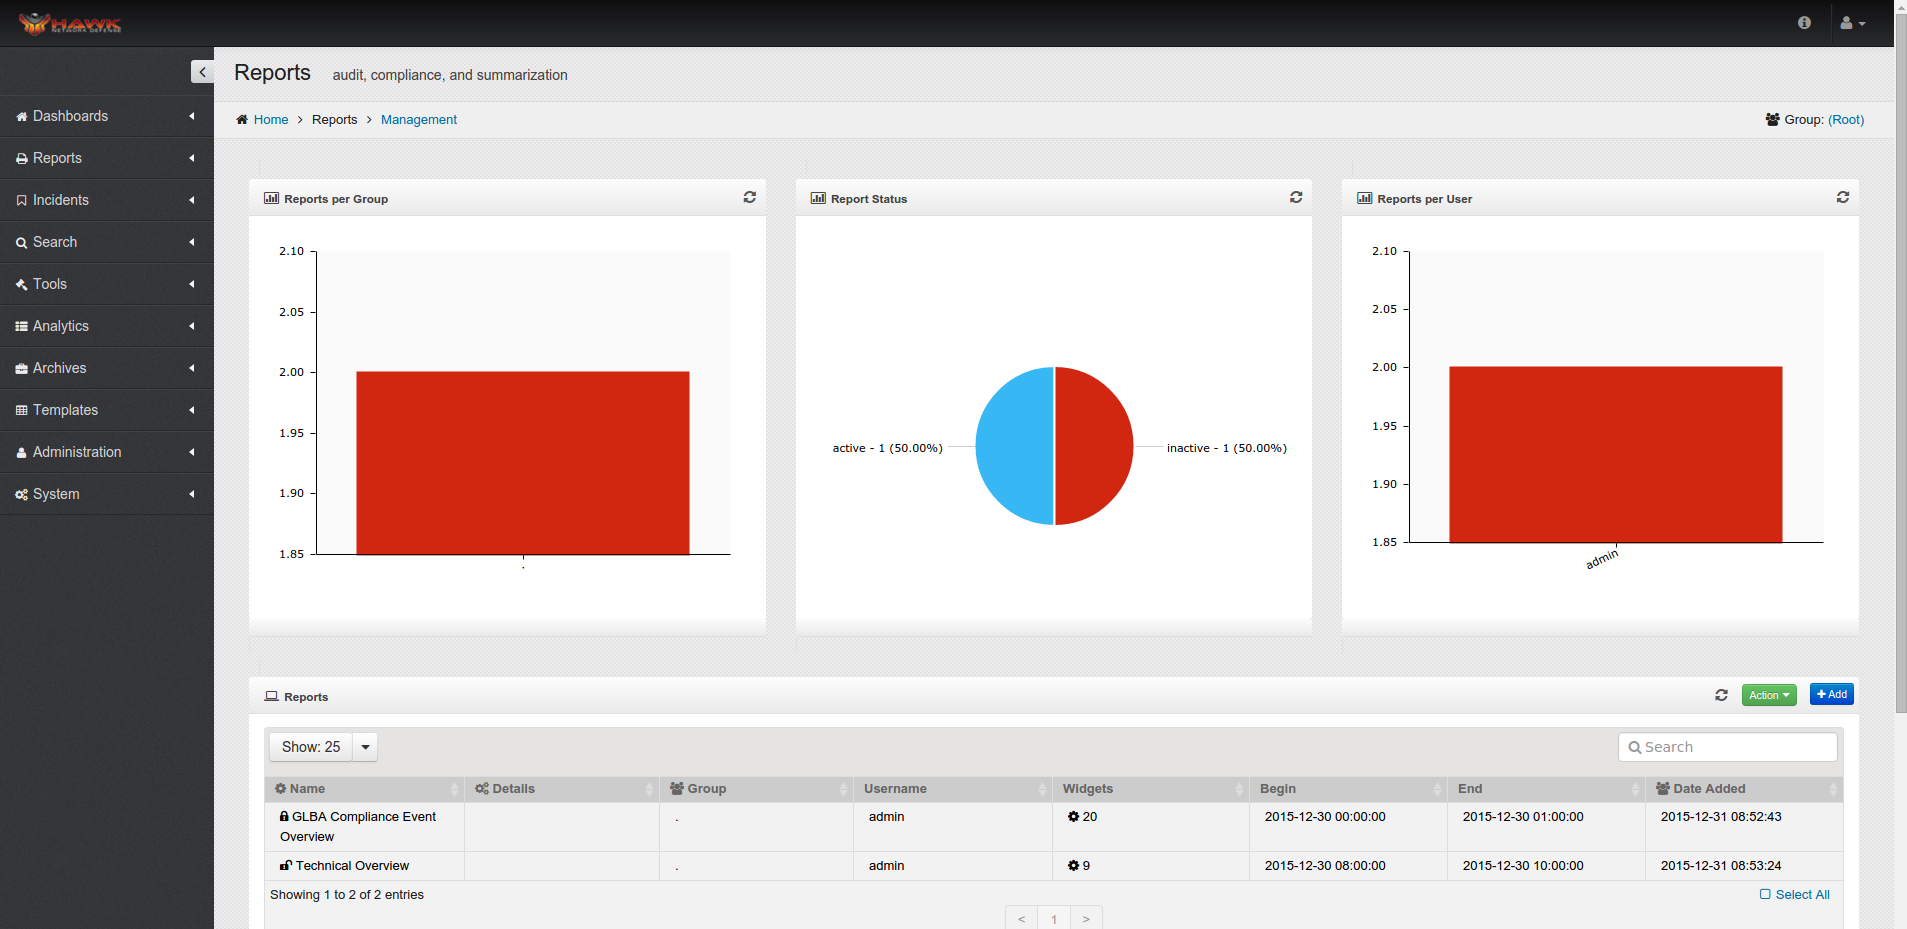
The Reports Dashboard opens.
The widgets that are shown include:
Reports per Group
Report Status
Reports per User
The current list of reports are shown, Which includes the following information for each report:
Name
Details
Group assigned
Username
Number of widgets
Beginning date of the report
Ending date of the report
Date the report was created
4.2. Selecting another Group for the Reports
Each Group can have individual reports created for that specific Group. The following shows the steps to change the Group in the Reports Dashboard.
On the navigation panel, click on .
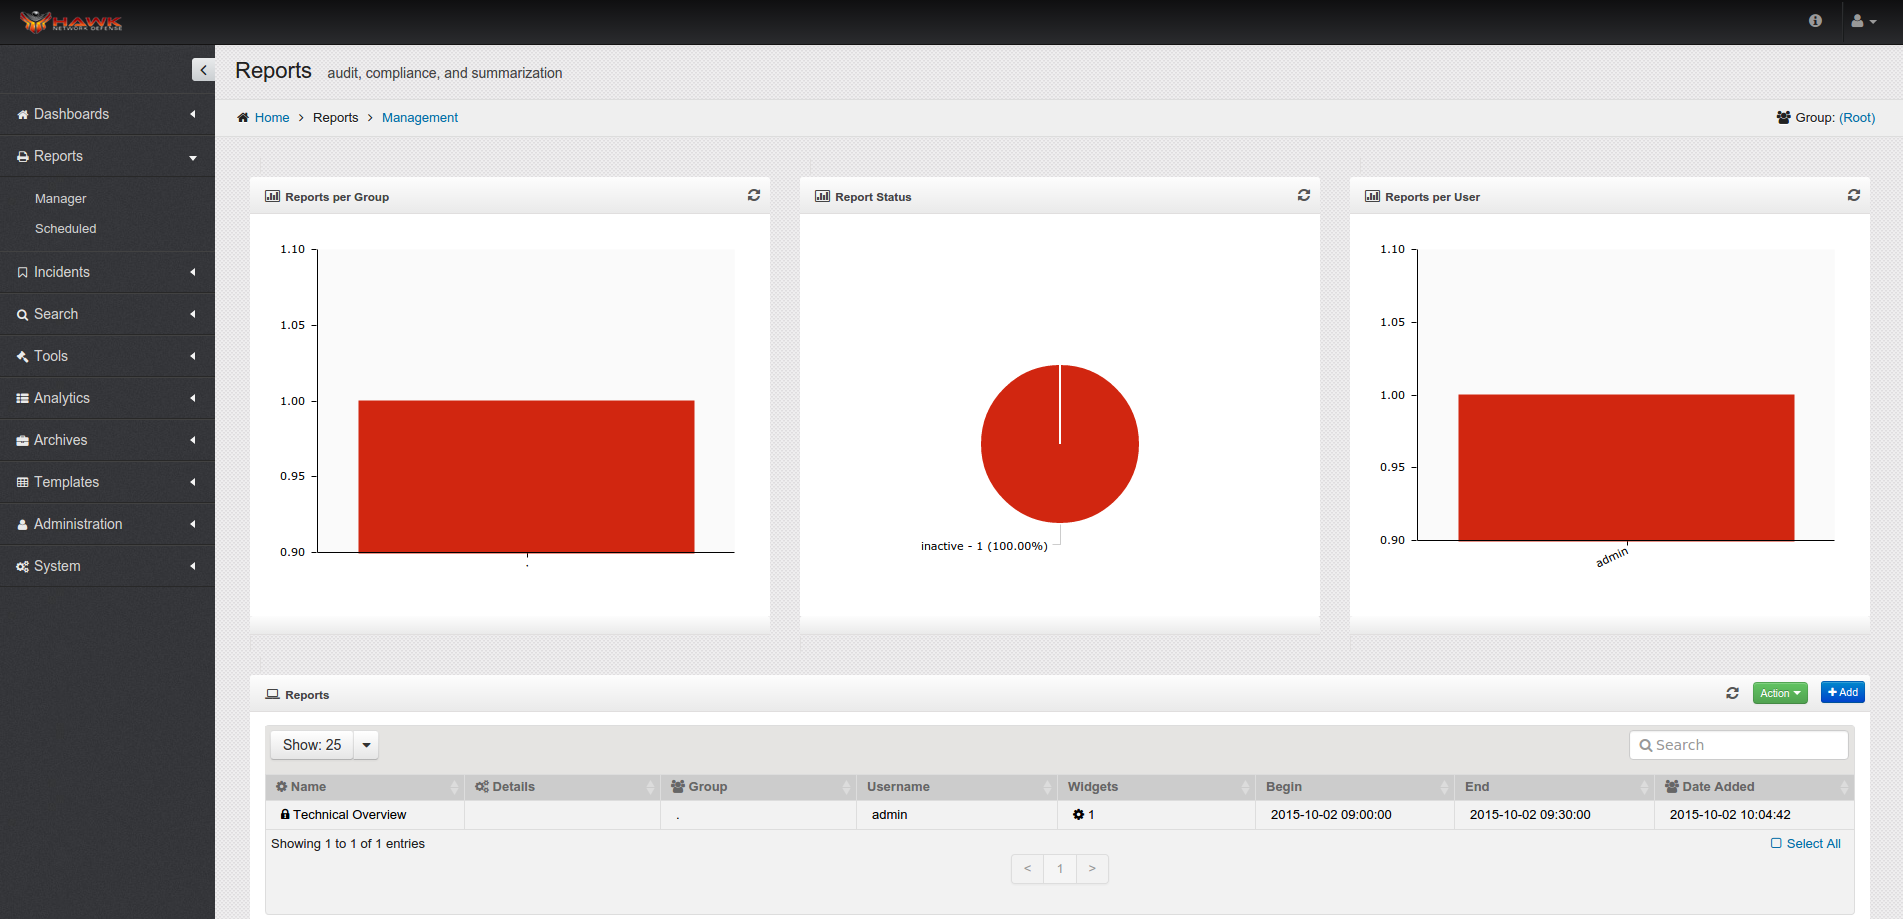
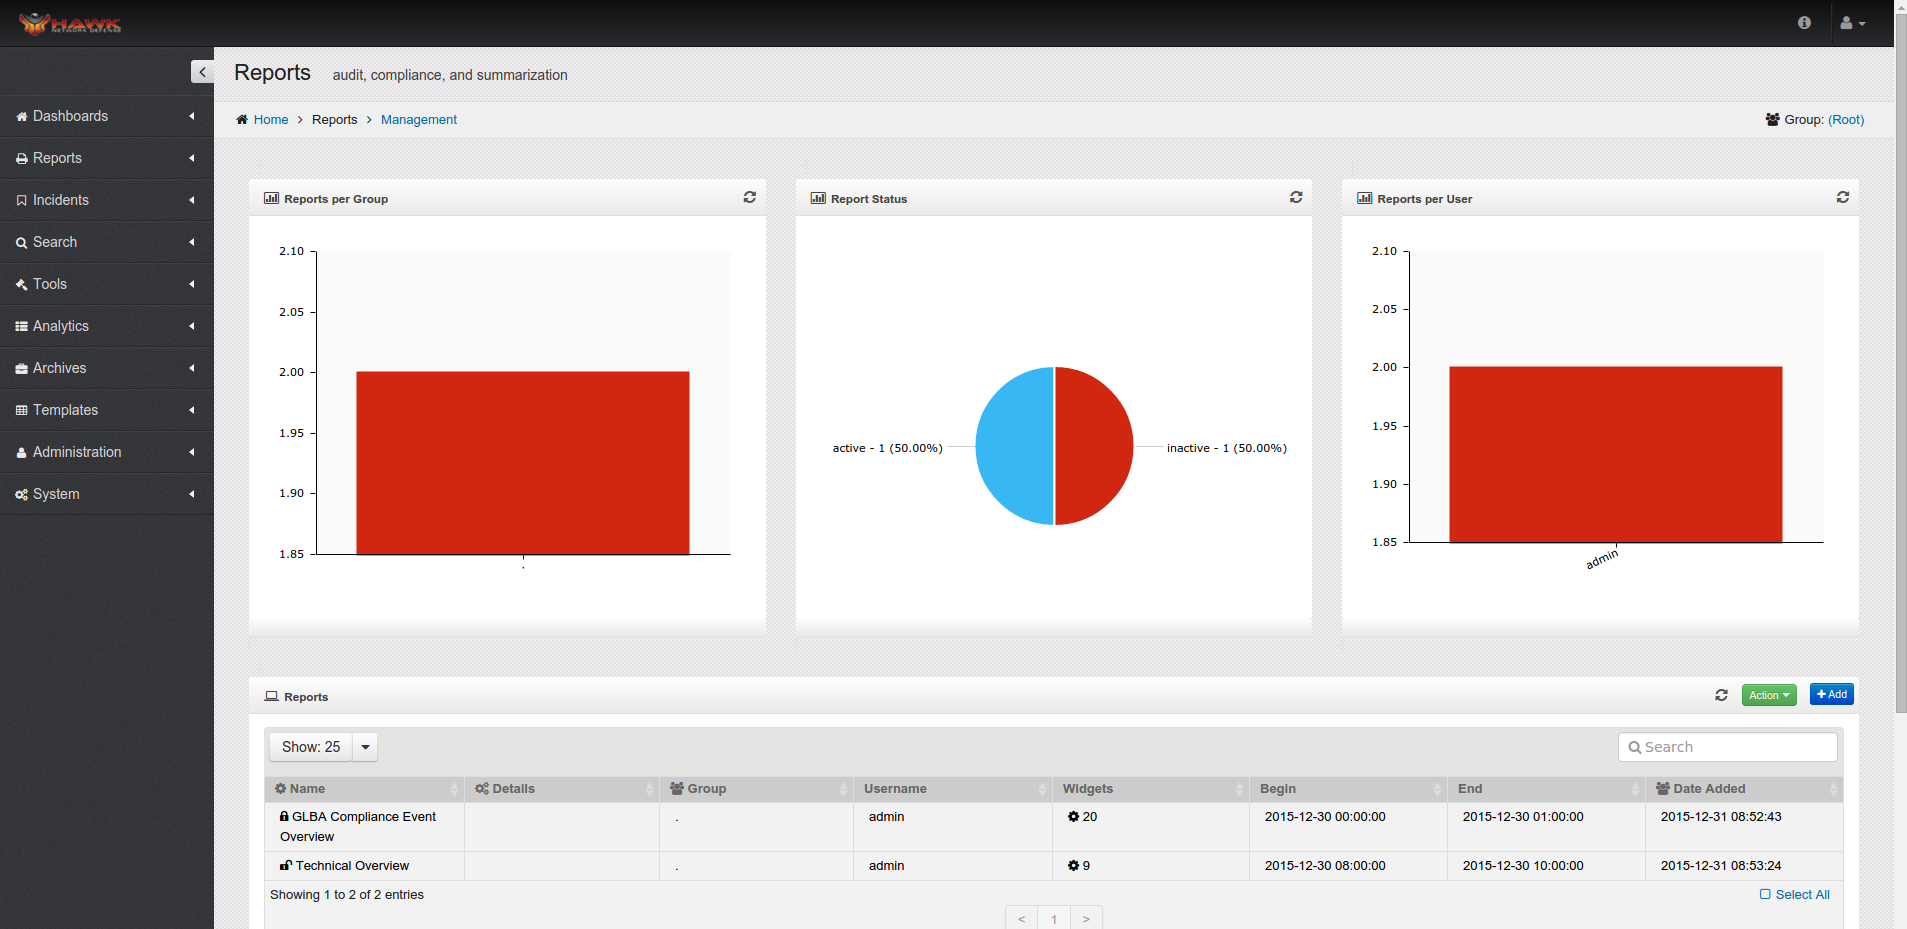
The Reports Dashboard open.
Locate the group link on the Dashboard toward the upper right.
Click on the link for the current Group, in this example it is (Root).
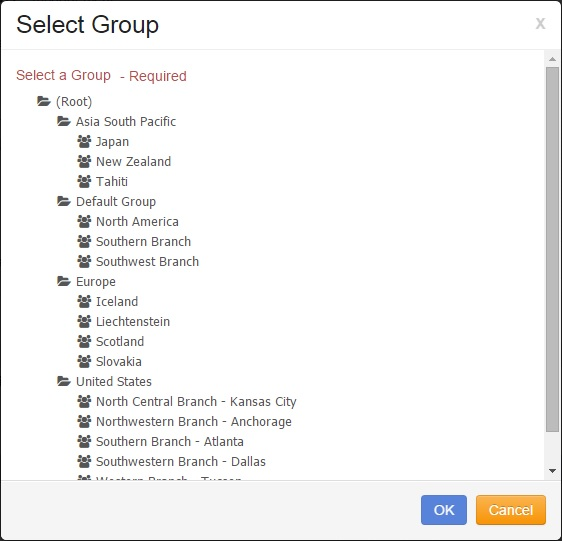
The “Select Group” window opens.
Click on the desired Group.
Click on the button.
The Report Dashboard is updated for the Group selected.
4.2.1. Managing Reports
There are a variety of activities that can be performed with the Reports, including creating new Reports, editing an existing Report, moving a Report to another Group, importing and exporting Reports, deleting Reports, and Scheduling the reports to run at specific times.
This section shows the steps to perform each of these actions on the Reports.
4.3. Creating New Reports
On the navigation panel, click on .
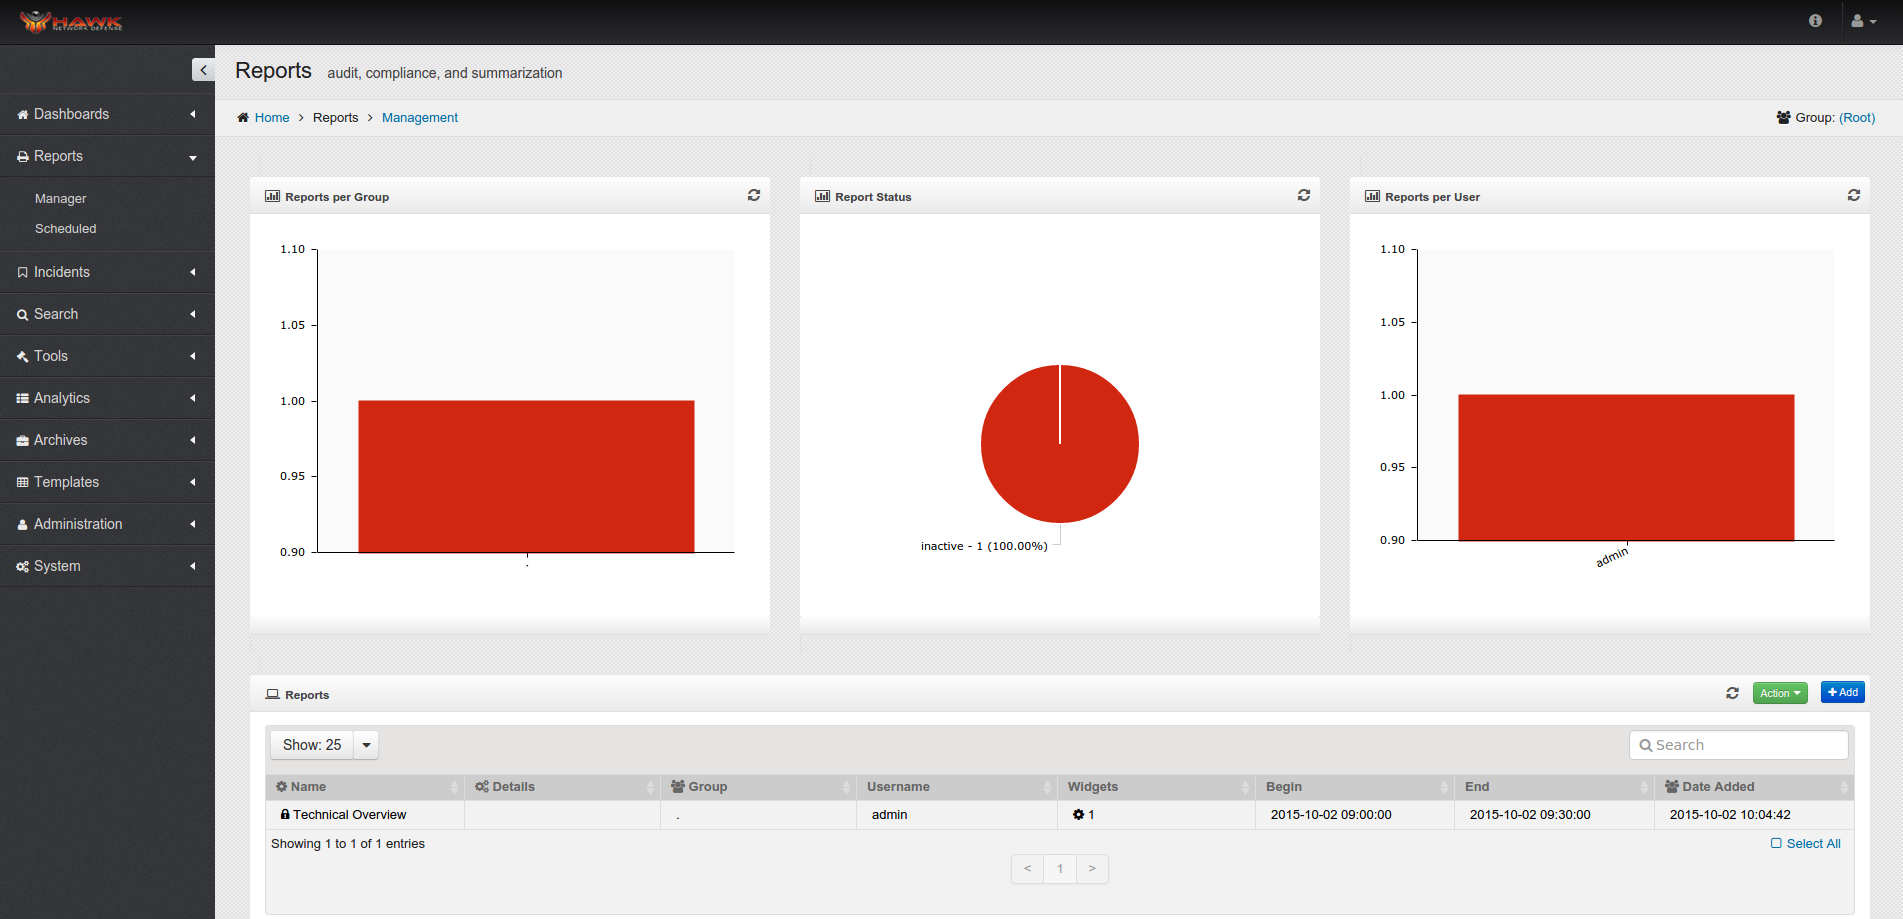
The Reports Dashboard open.
Click on the button.
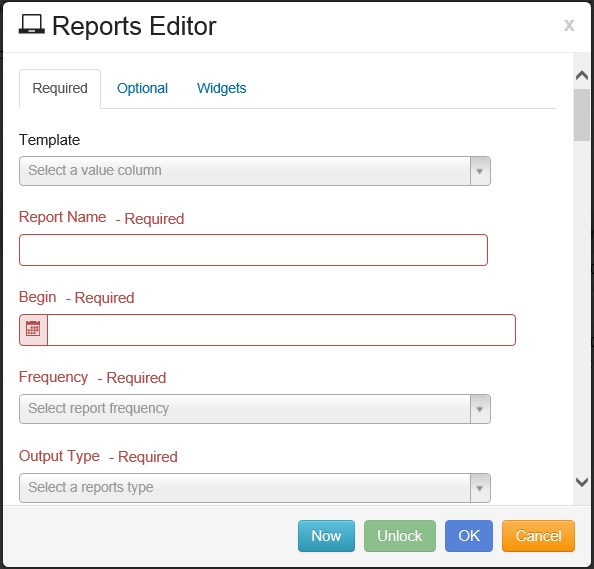
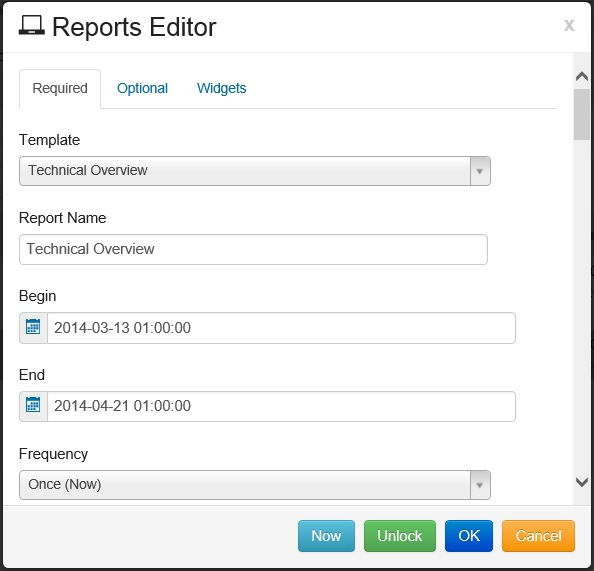
The “Reports Editor” opens in the “Required” tab, as shown:
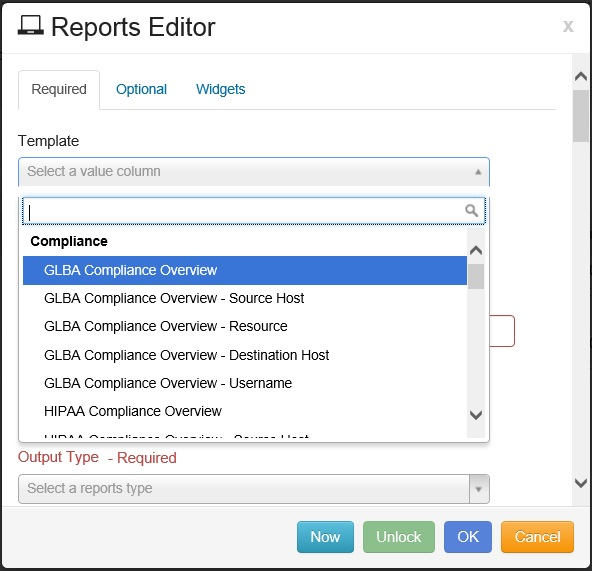
You can either select a Template for the Report by clicking on the drop-down menu under Template, or create a report from scratch by not selecting a Template.
Note
If you use a Template this will populate the Report Name and any widgets assicated with that templete. You can edit the template values and/or widgets to fit your needs.
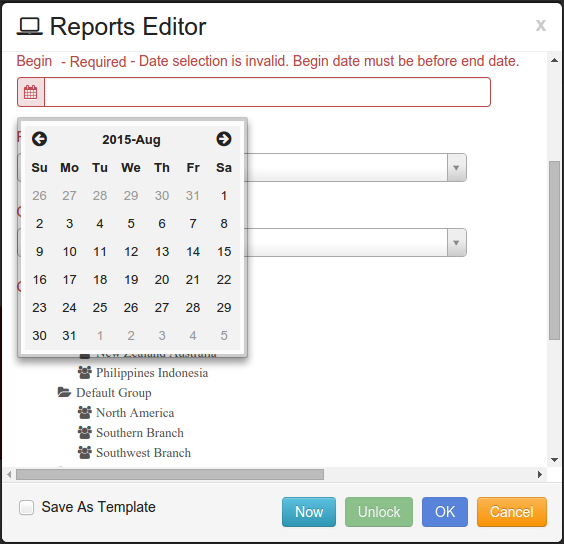
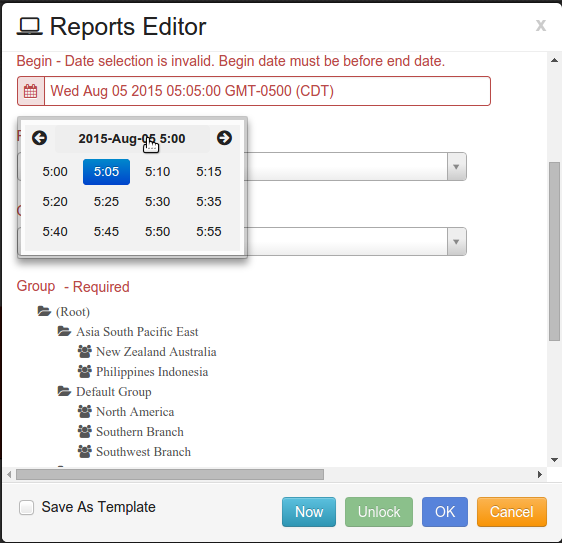
The next step is to select the date for the beginning of the Report. Click on the calendar on the left side of the Begin field. Click on the desired date for the Report to begin.
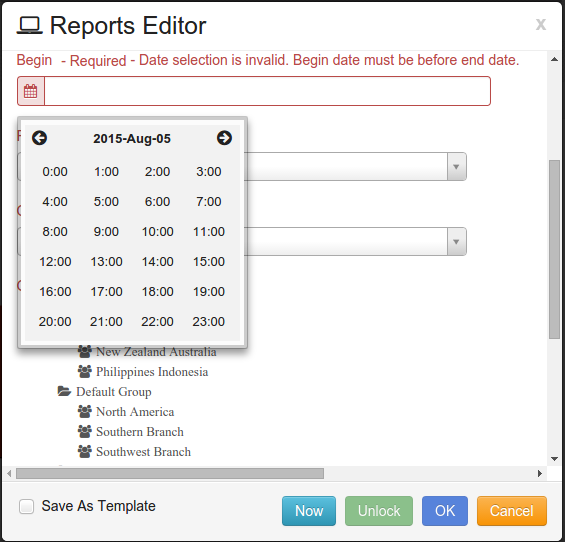
The next step is to select the hour for the report to begin. Once the date is selected, the time selection opens. This selection display is based on a 24 hour clock. Click on the hour that the Report is to start running.
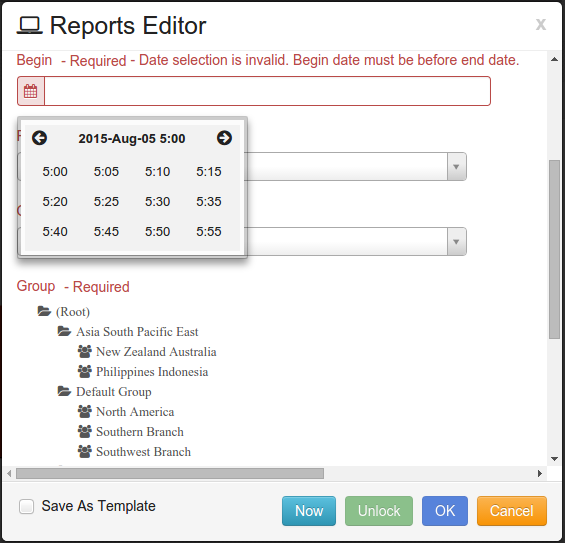
The next step is to select the Minute for the beginning of the report. The Minutes are available in five minute increments. Click on the desired five minute interval for the Report to begin.
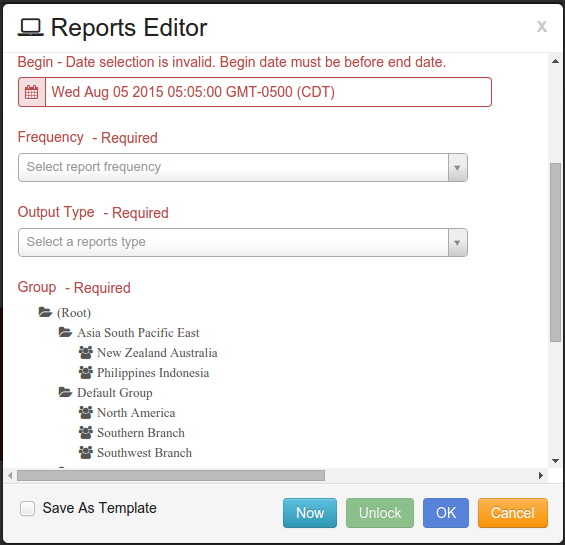
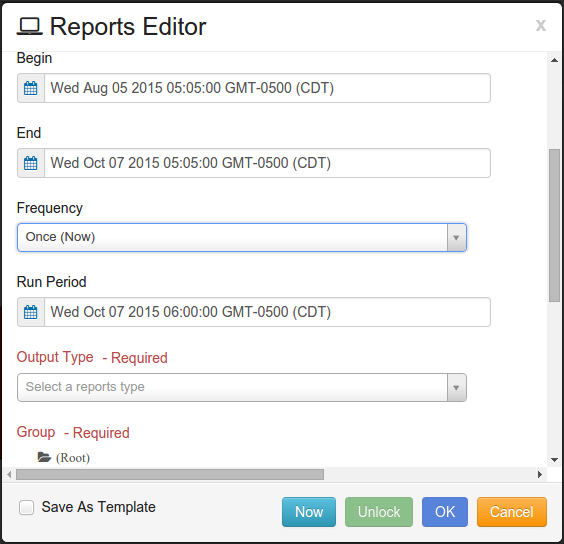
When the date, hour, and minute are selected, the Begin field is populated, as shown:
Note
If you need to change the Date and Time you can click on the calendar on the left side of the begin field. To go back click on the center date.
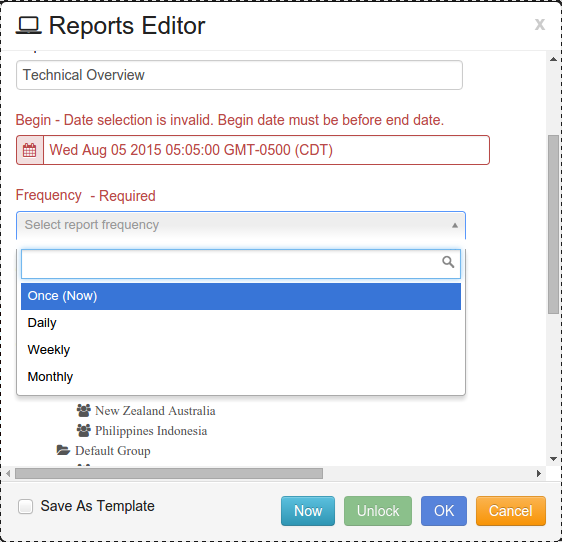
Next, select the time frame for how frequently the new Report is to run. The options for Frequency are:
Once (Now)
Daily
Weekly
Monthly
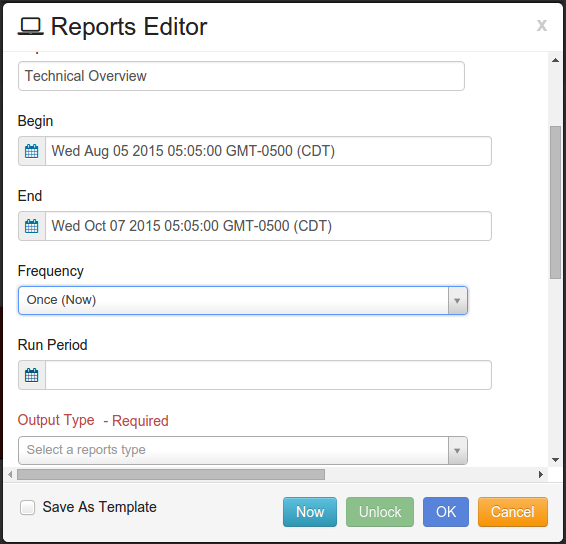
If “Once (Now)” is selected as the Frequency, an end time must be entered, as shown here:
For the End time, the same calendar opens to select the end time, hour, and minute that was shown for the Begin time. Select the Date, Hour, and Minute that the report is to end.
If “Once (Now)” is selected as the Frequency, the next step is to select the Run Period. The time selected is when the report will run. Select the Date, Hour, and Minute that the report is to run.
Note
If no Run Period is selected or if the time is in the past. The report will run once you click button.
If Daily, Weekly, or Monthly is selected for the Frequency, the End time and Run Period are not entered.
The next step is to select the Output Type which determines whether the output of the Report is put into a PDF or CSV format.
Click on the drop-down menu next to Output Type and click on either PDF or CSV.
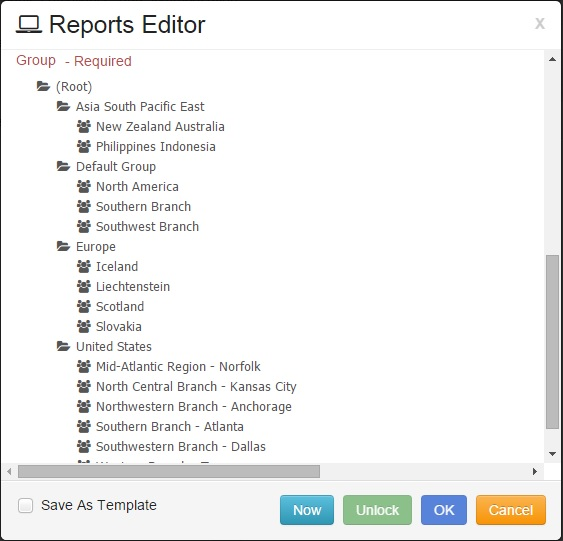
The next step is to select the Group on which the new Report is run by clicking on the desired Group.
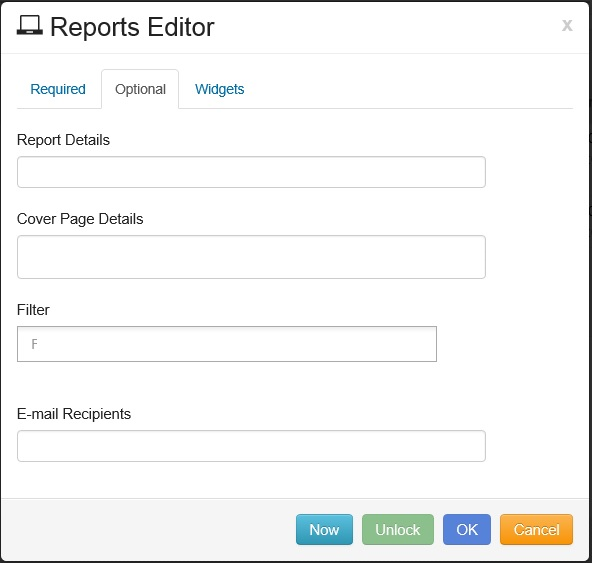
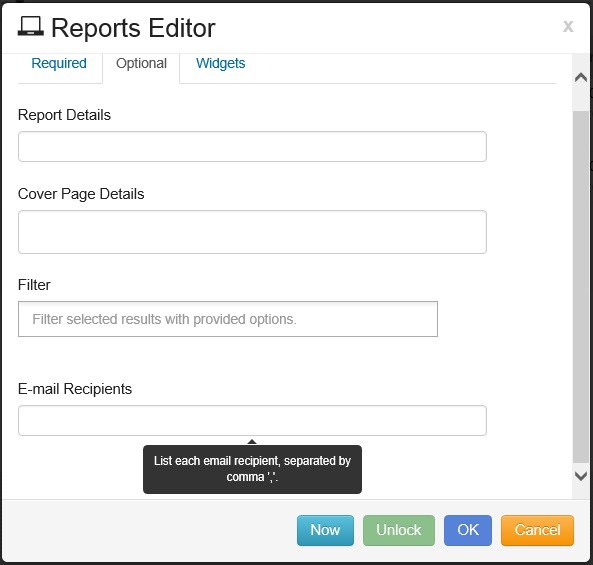
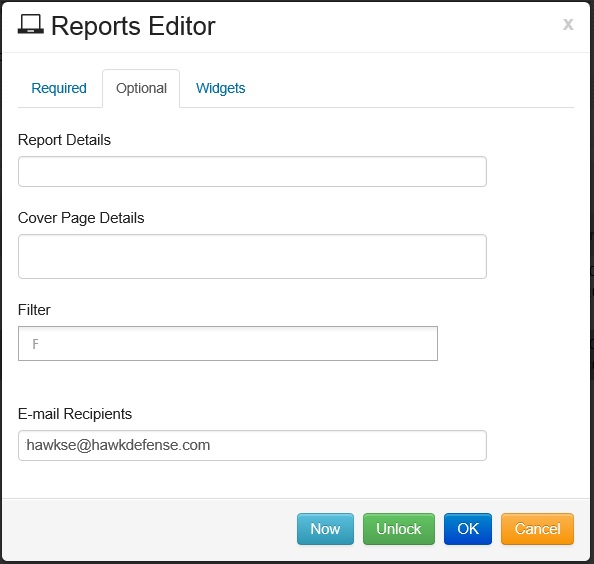
The next step is to click on the tab. This allows additional information to be entered about the report.
Enter a brief description of the Report in the Report Details field.
Enter the description to be placed on the cover page in the Cover Page Details field.
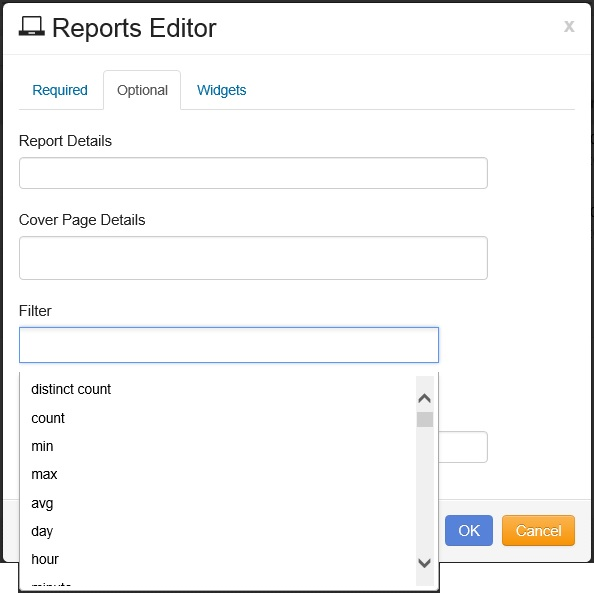
The next step is to select the Filter for the Report, by clicking on the drop down menu for Filter. The entire list of choices is found in the Reference Guide.
This is a Report wide Search argument, for example:
class_type = “Firewall”
class_type = “IDS”
If the Report is to be emailed, enter the entire E-Mail address for each recipient, separated by a comma ‘,’.
Click on the tab.
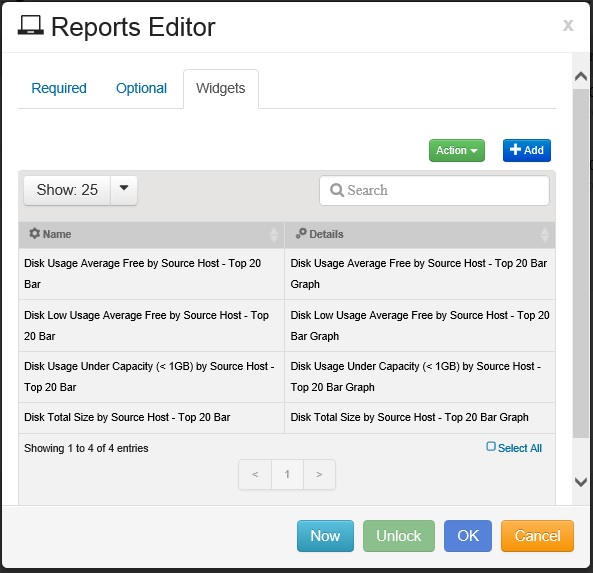
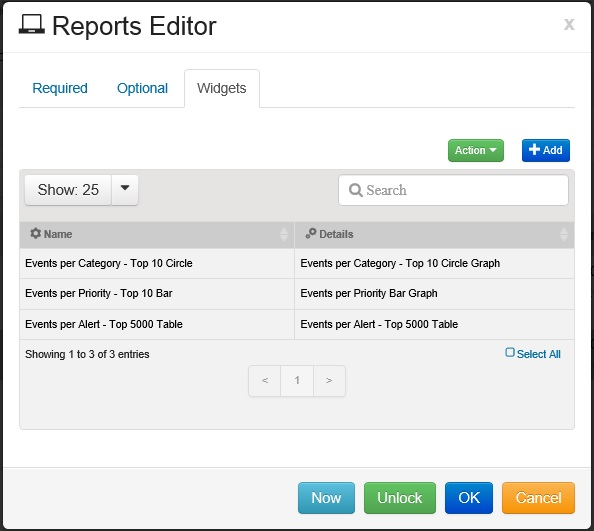
Widgets are added to the Reports by default if a template was selected. The list of Widgets for the Report can be edited and removed, or new Widgets can be added.
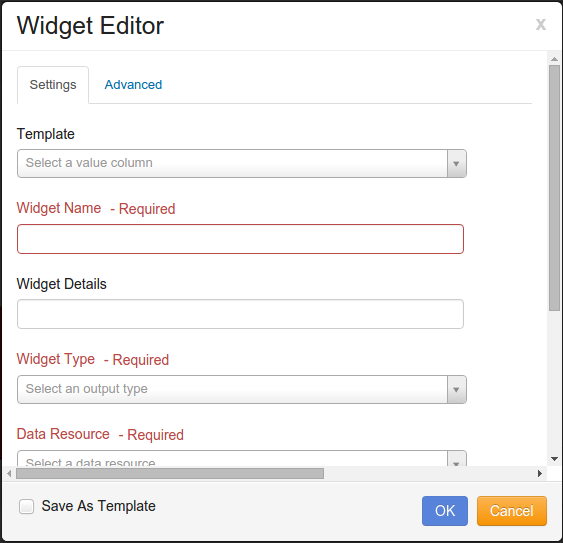
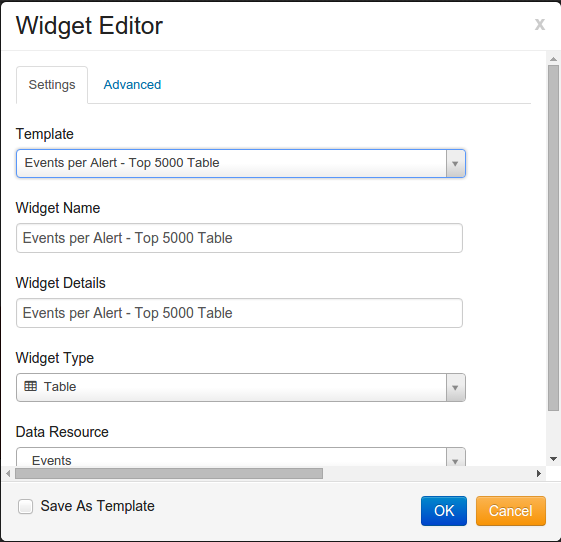
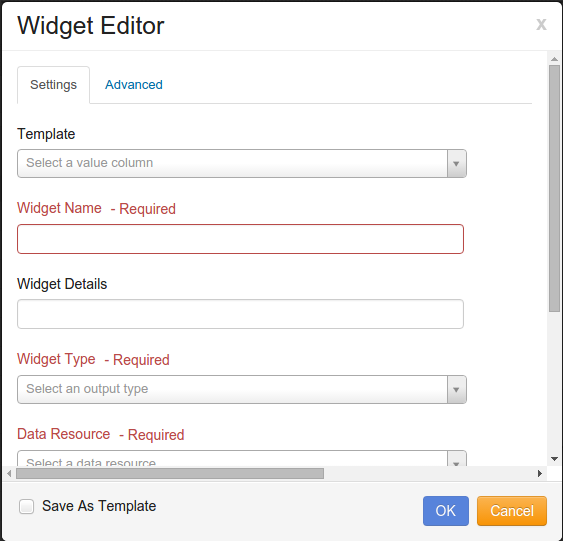
If a new Widget needs to be added to the Report, on the Widgets tab, click on the button, and the “Widget Editor” opens:
Note
Skip the following step if creating a widget from scratch.
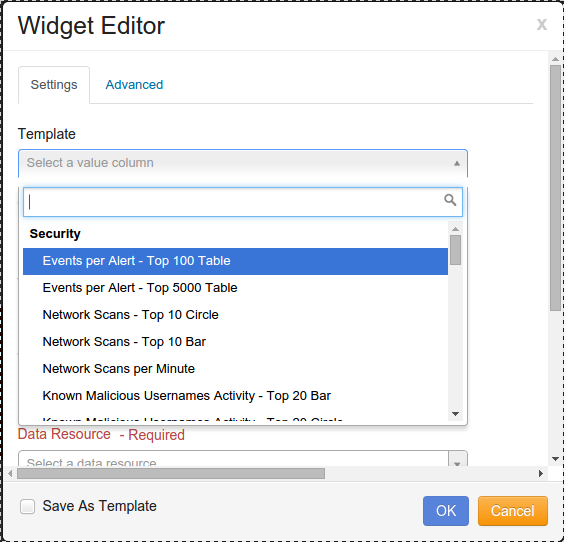
The first item to identify for the Widget is the type of Template.
Click on the drop-down arrow to select the Template for the Widget, and click on the desired template.
Numerous Templates are currently defined, and new Templates are easily created and added.
Enter the Widget Name that is to appear on the Report.
Enter the Widget Details that better describes the data contained in the Widget.
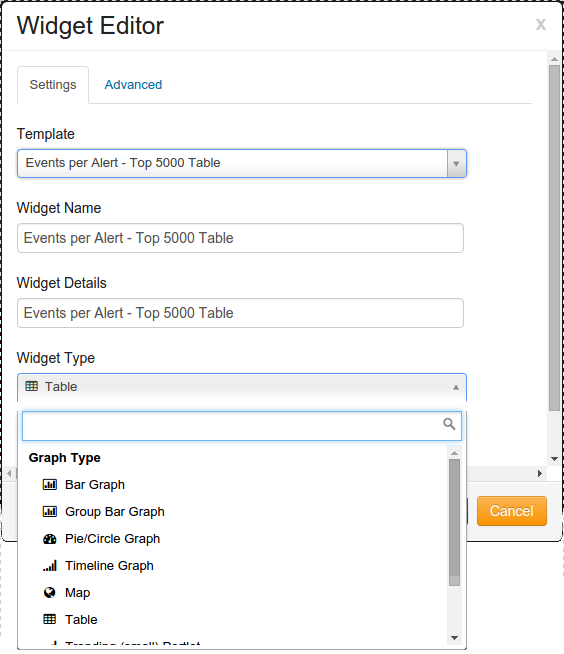
The next item to define for the Widget is the Widget Type, which identifies the manner in which the data is displayed on the Report. There are several Widget Types available, including:
Bar Graph
Group Bar Graph
Pie/Circle Graph
Timeline Graph
Map
Table
Trending (small) Portlet
Trending (Large) Portlet
Node-Link Relationship
Click on the drop-down arrow by Widget Type, and select the desired Type.
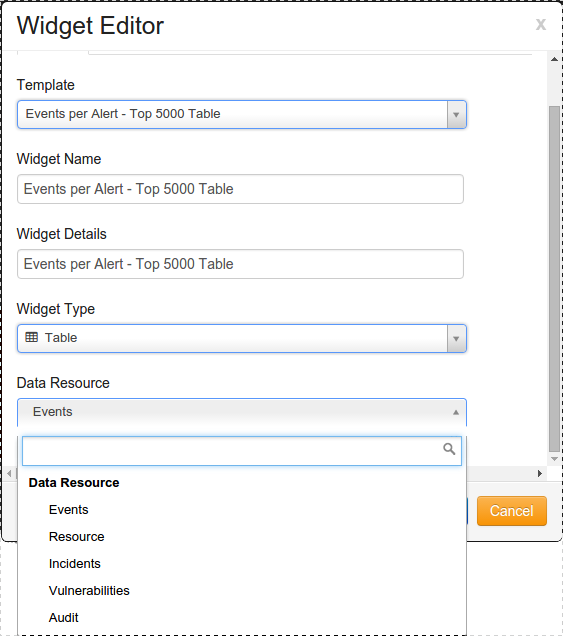
The next criteria to define for the Widget is the Data Resource.
Click on the drop-down arrow by Data Resource to select the desired resource. The options include:
Events
Resource
Incidents
Vulnerabilities
Audit
Before the X and Y axis can be defined, the Columns, Filter, Group, Sort, must be selected and Limit must be entered.
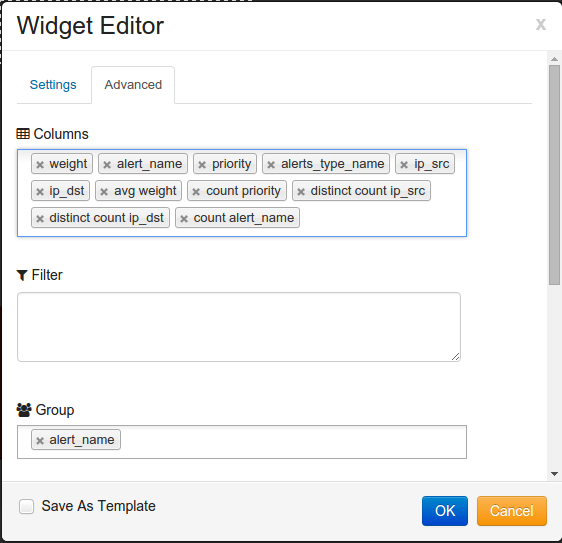
Click on the tab.
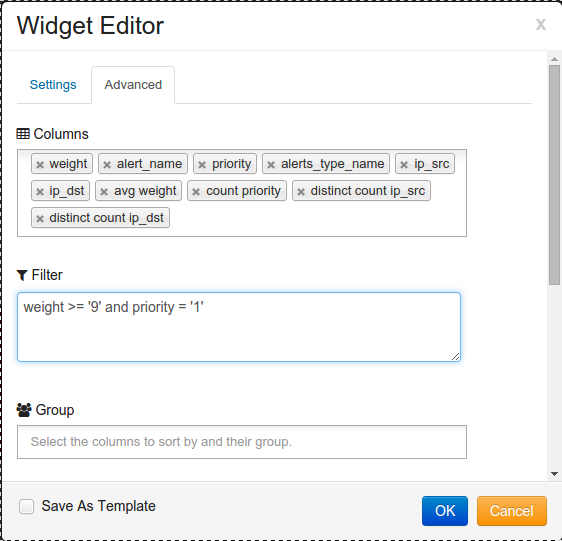
Click on the field for Columns, and click on the desired columns which are to be used.
The next step is to select the Filter for the Widget. Click on the field for the Filter and select the desired Filter for which the results on the Widget are displayed.
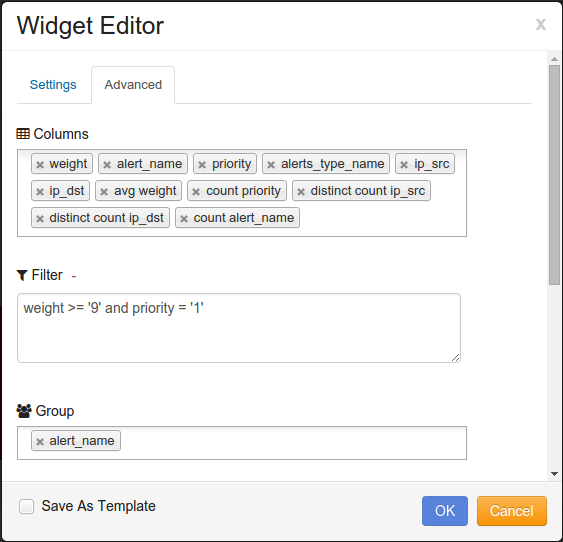
The next step is to identify how the data on the Widget is grouped. Under the Group field, select the columns to group by.
Note
It is required to have a aggregation column for group by. i.e. ‘count alert_name’
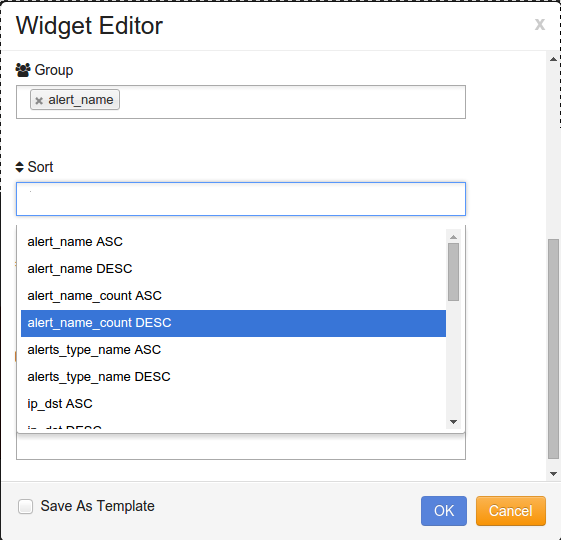
After the Group is defined, the next step is to select the columns that are to be sorted and their order.
Click on the Sort field and select the columns on which the data is sorted.
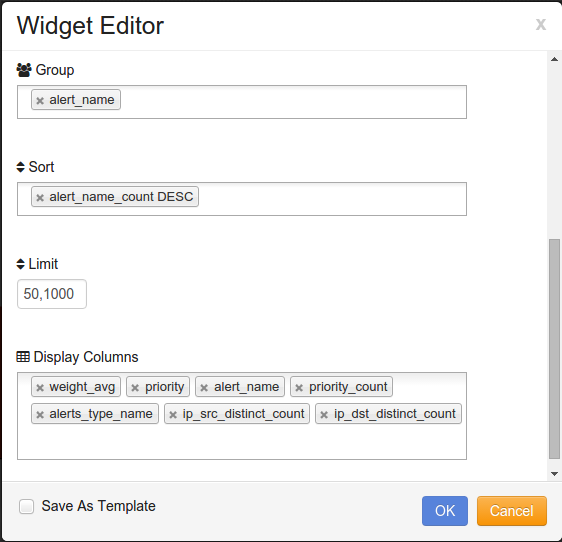
The next step is to enter the limit. The limit number controls the number of results that are returned.
Note
You can enter a single number (17) or offset, number (10,17). Offset is how many records to skip before returning results.
If this field is left blank, it returns all records.
If a Widget Type of Table was selected. The next step is to list the columns in the order you would like them to be displayed.
Once the items in the tab are identified, the labels for the X and Y axis can be defined.
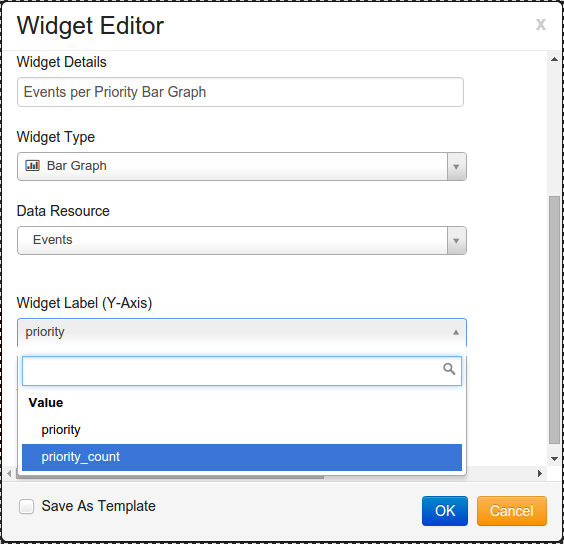
Click on the tab and click on the Widget Label (Y-Axis) select the column to be used for the Y-axis.
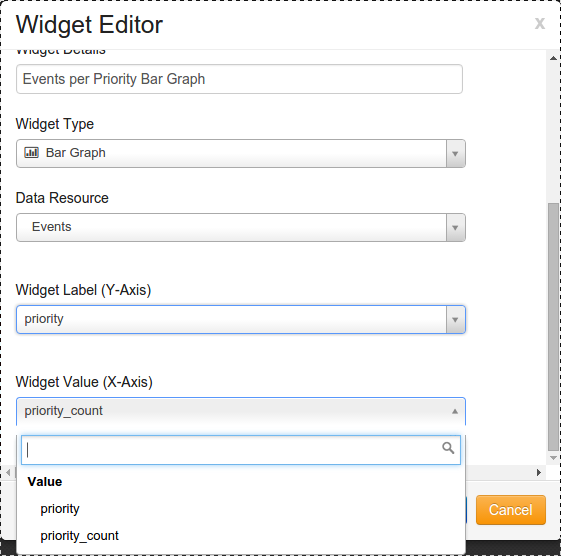
Next, click on the Widget Label (X-Axis) select the column to be used for the X-Axis
When all components are defined for the Widget, Click on the button to save the criteria for the Widget, or click on the to cancel creating the new Widget for the Report.
You can now either add another Widget or update an existing Widget. Once you are done you can either click on the button to save your report and it will run at the scheduled time. You can click on to cancel creating the new Report. You may also click on to run a test report.
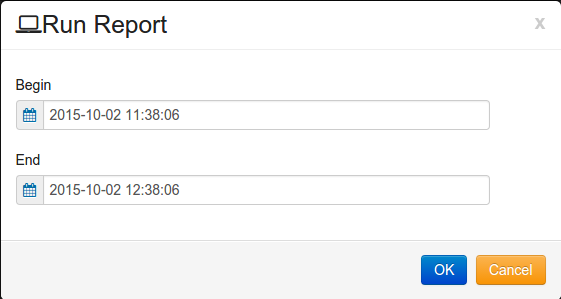
If was selected, a Run Report window opens.
Select a Begin and End time. Suggest time frame for a test report is 15 to 30 minutes.
Click on the to run the Test Report or click on the to cancel running the Test Report now.
4.4. Editing Existing Reports
Existing Reports can be edited at any time, by following these steps:
On the navigation panel, click on .
The Reports Dashboard opens.
Double click on the desired report to change.
The “Reports Editor” window opens showing the current settings for the selected Report.
The following fields can be modified in the tab:
Template
Begin Date
End Date
Frequency
Output Type
Group
If there is information in the tab that needs to be changed, click on the tab.
The following information can be changed on this tab:
Report Details
Cover Page Details
Filter
E-mail Recipients
If changes need to be made to the Widgets. Click on the tab.
A new Widget can be added by clicking on the button.
Widgets can be imported by clicking on the button.
Widgets can be exported by clicking on the button.
Widgets can be removed by clicking on the button.
Reports can be unlocked by clicking on the button.
4.5. Moving Reports to another Group
If a Report is to be moved to another Group, Follow these steps:
On the navigation panel, click on .
The Reports Dashboard opens.
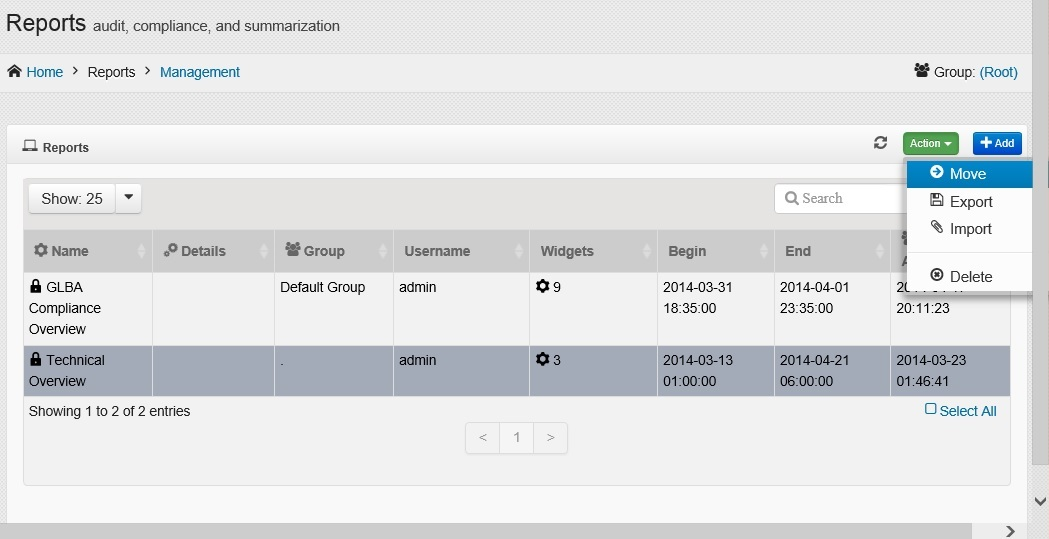
Click on the desired Report or Reports to move.
Click on the button.
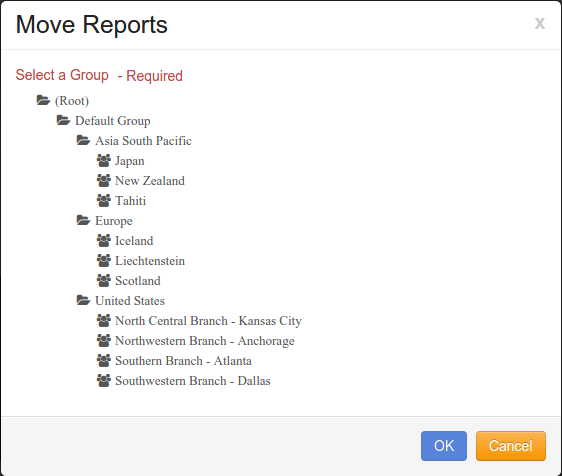
The “Move Reports” window opens.
Click on the Group where the selected Report or Reports is to be moved.
Click the button to move the selected Report or Reports. To stop the move, click on the button.
4.6. Exporting Reports
If a Report is to be exported to a csv file, Follow these steps:
On the navigation panel, click on .
The Reports Dashboard opens.
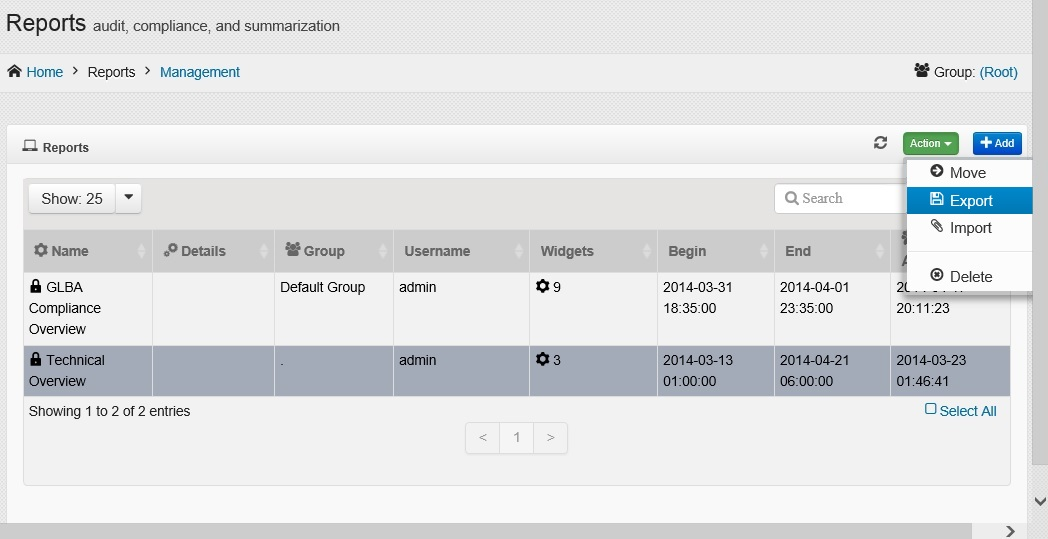
Click on one or more desired reports to export.
Click on the button.
Select the destination for the report to be exported to and click on “save” button.
The Report is now Exported to the destination file.
4.7. Importing Reports
If a Report is to be imported, follow these steps:
On the navigation panel, click on .
The Reports Dashboard opens.
Navigate to the desired Group to import into.
Click on the button.
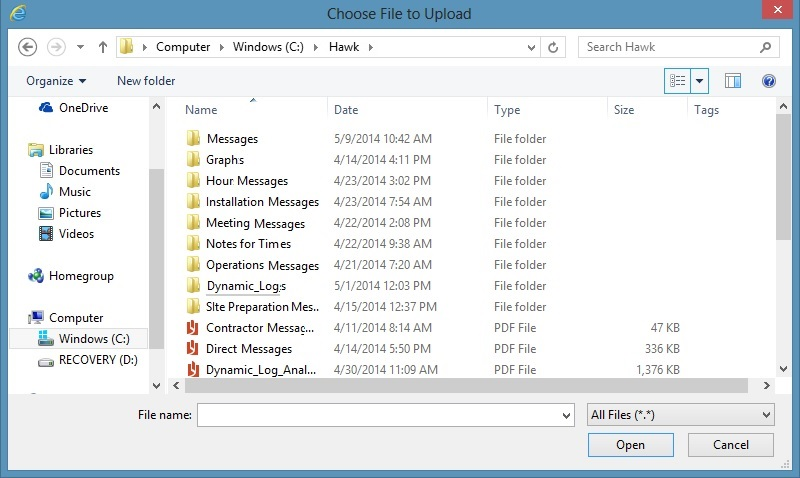
The “Choose File to Upload” window opens.
Click on the file to import.
Click on the “Open” button.
The selected file is imported into the Reports Dashboard.
4.8. Deleting Reports
If a Report is to be permanently deleted, follow these steps:
On the navigation panel, click on .
The Reports Dashboard opens.
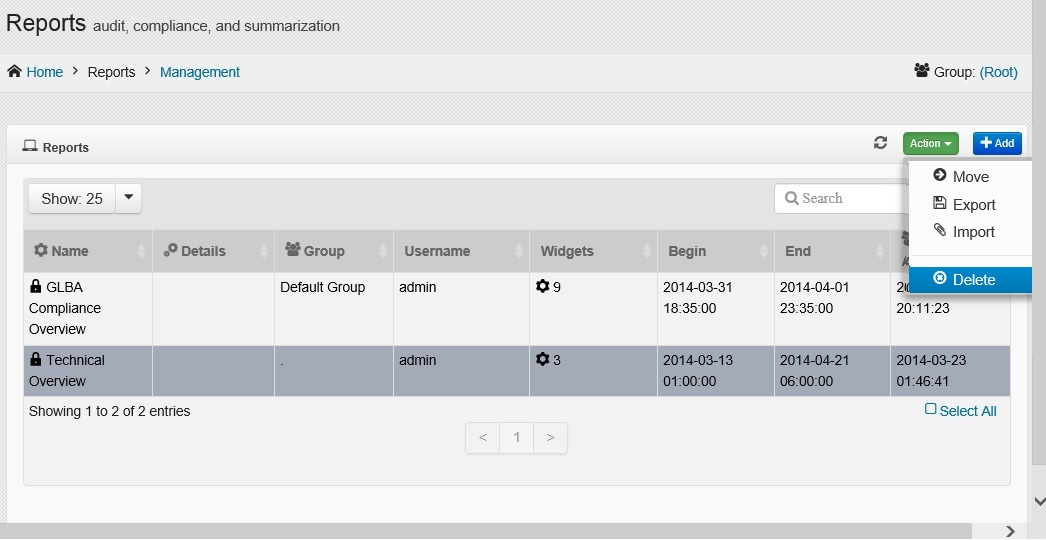
Click on one or more Reports to delete.
Click on the button.
A confirmation dialog box opens to confirm that the selected Report is to be permanently deleted. Click on the “Yes” button to delete the selected Report. If the selected report is not to be removed, click on the “No” button.
Note
When deleting a report, It will only delete it from the User Interface. The report will still exist on the backend server located at ‘/var/www/hawk-data/reports’. If a report is accidently deleted notify the System Administrator to recover the file.
4.8.1. Scheduled Reports
Reports can be Scheduled, by following these steps:
On the navigation panel, click on .
The Scheduled Reports Dashboard opens.
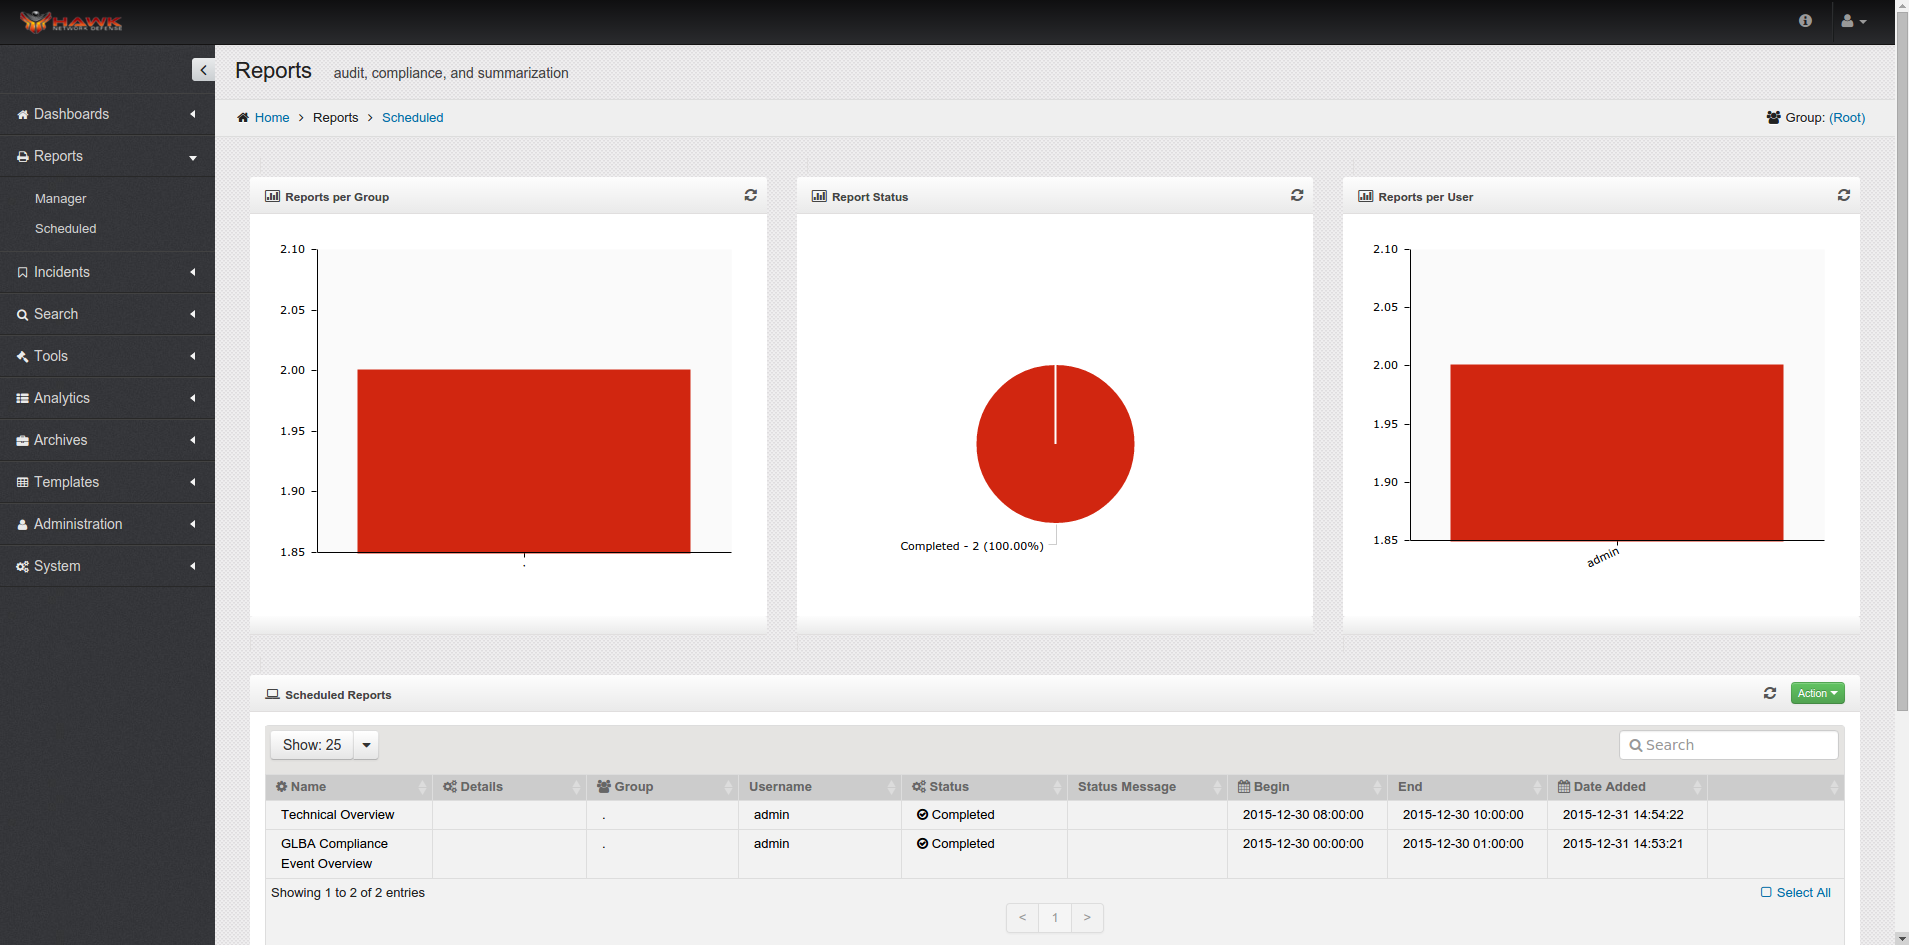
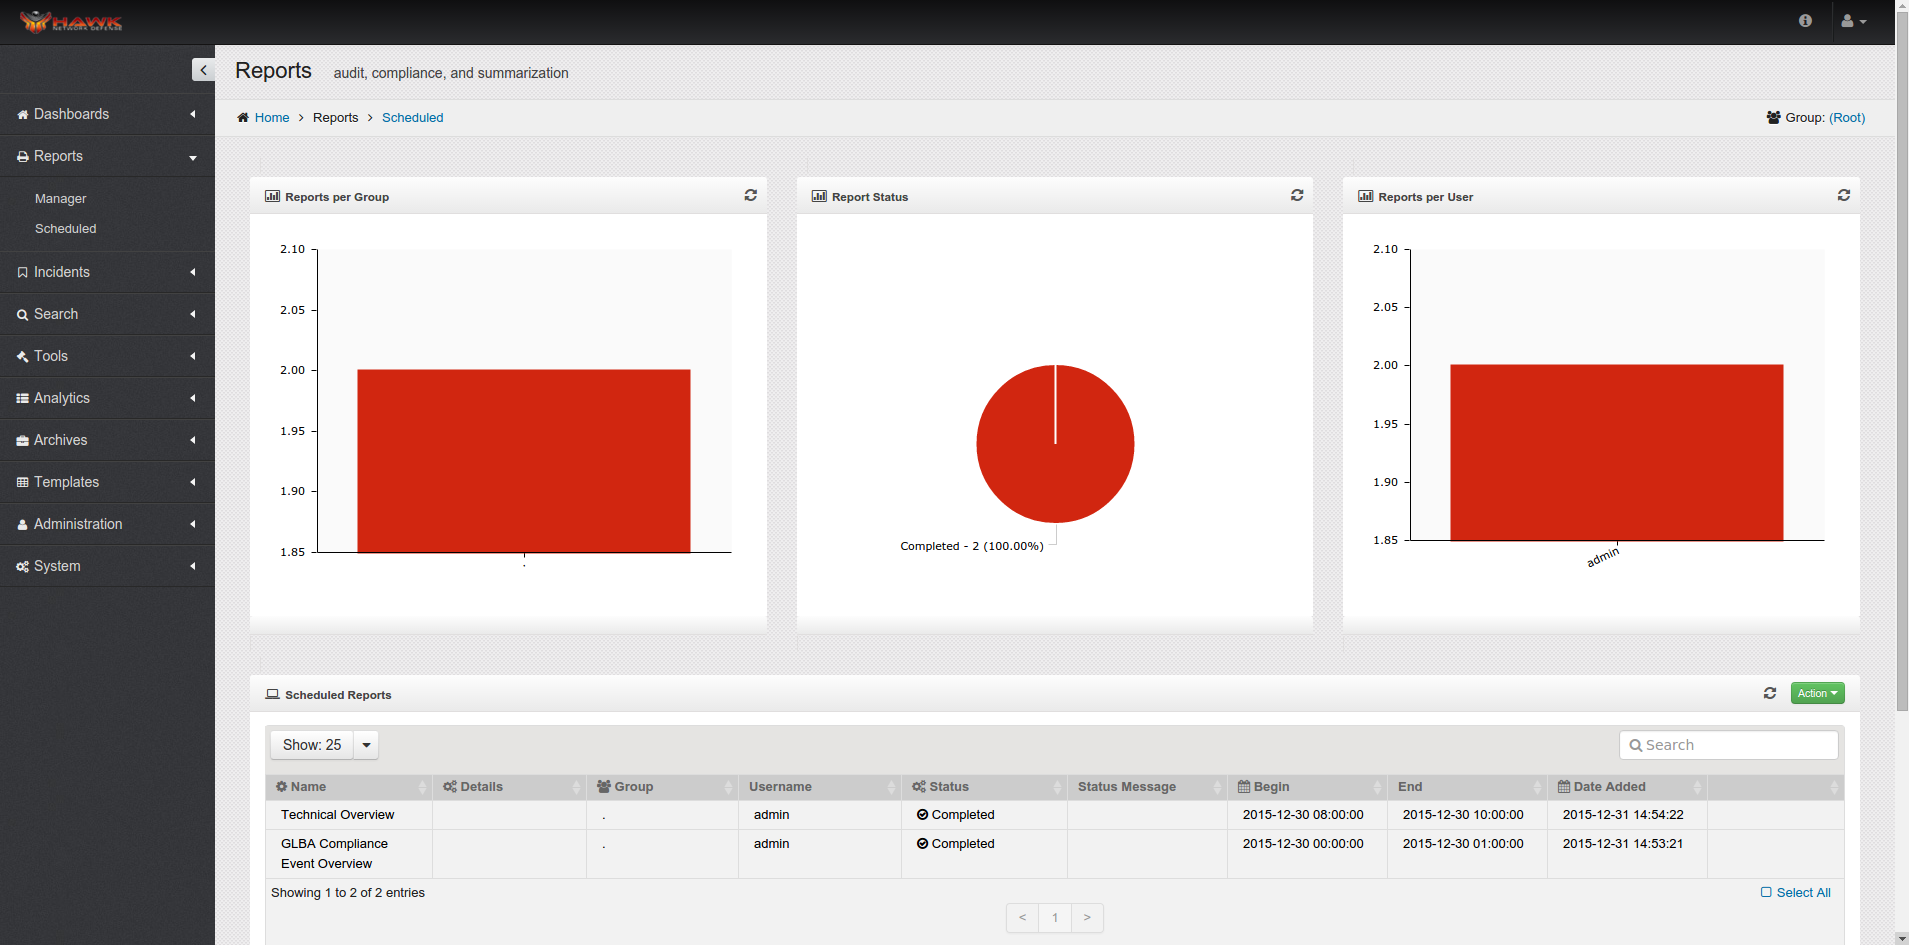
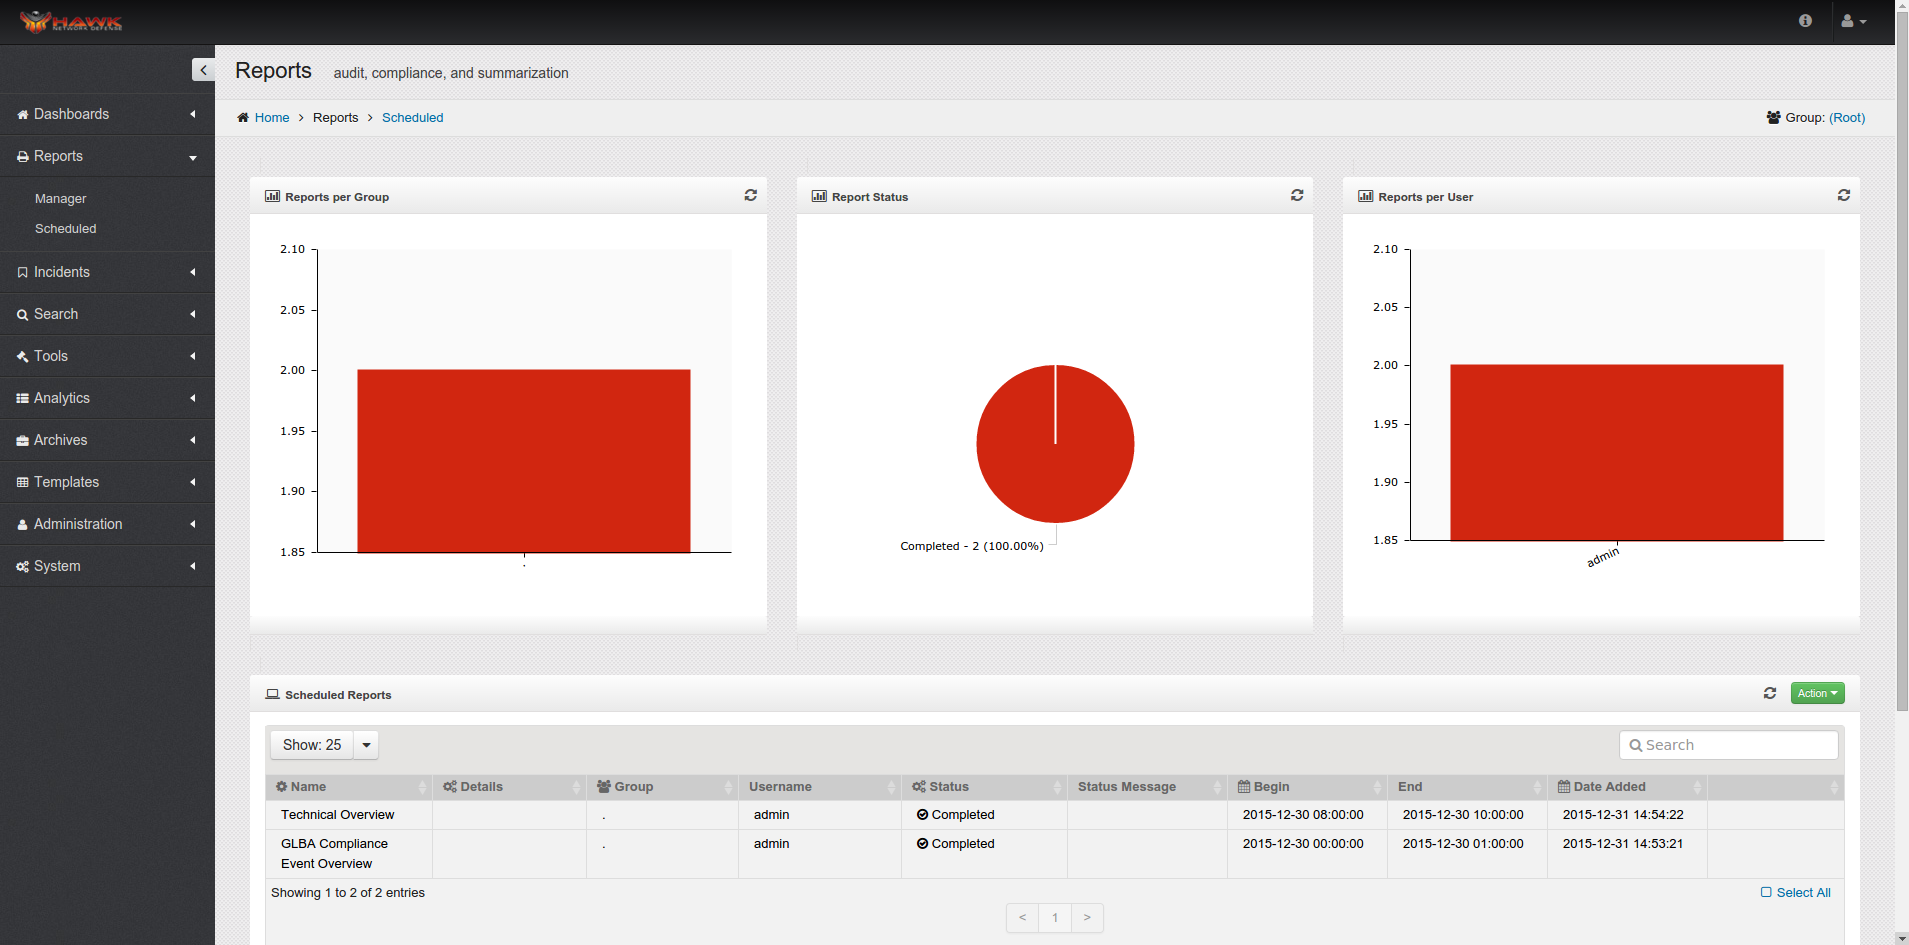
The Widget information shown on this Dashboard includes:
Reports per Group -
Report Status - Which the number and percentage of Reports which failed and which were successful.
Reports per User - Shows the number of Reports each user requested.
The bottom section of this Dashboard shows the following information about the Reports which have been scheduled to run on specific intervals:
Name
Details
Groups
Username
Status of the Report which indicates whether the Report Completed, Failed, Pending, In Progress, or Canceled.
Status Message
Beginning Date and Time for the Report
Ending Date and Time for the Report
Date the Report was added to the schedule
Note
When the report is processing, an icon appears in the far right column on the row of the report being processed, clicking on that icon stops processing of that report.
4.9. Viewing/Downloading Scheduled Reports
The Scheduled Reports can be viewed by following these steps:
On the navigation panel, click on .
The Scheduled Reports Dashboard opens.
Double-click on the Report to view. The Report opens in either a PDF or CSV format, depending on the report configuration.
You can also select one or more reports that you want to download.
Click on the button.
Select the destination for the report to be saved to and click on “save” button.
4.10. Deleting Scheduled Reports
The Scheduled Reports can be permanently deleted by following these steps:
On the navigation panel, click on .
The Scheduled Reports Dashboard opens.
Click on the Report or Reports to delete.
Click on the button.
A confirmation dialog box opens to confirm that the selected Scheduled Report or Reports is to be permanently deleted. Click on the “Yes” button to delete the selected Scheduled Report. If the selected Scheduled Report is not to be removed, click on the “No” button.
4.10.1. Working with Report Templates
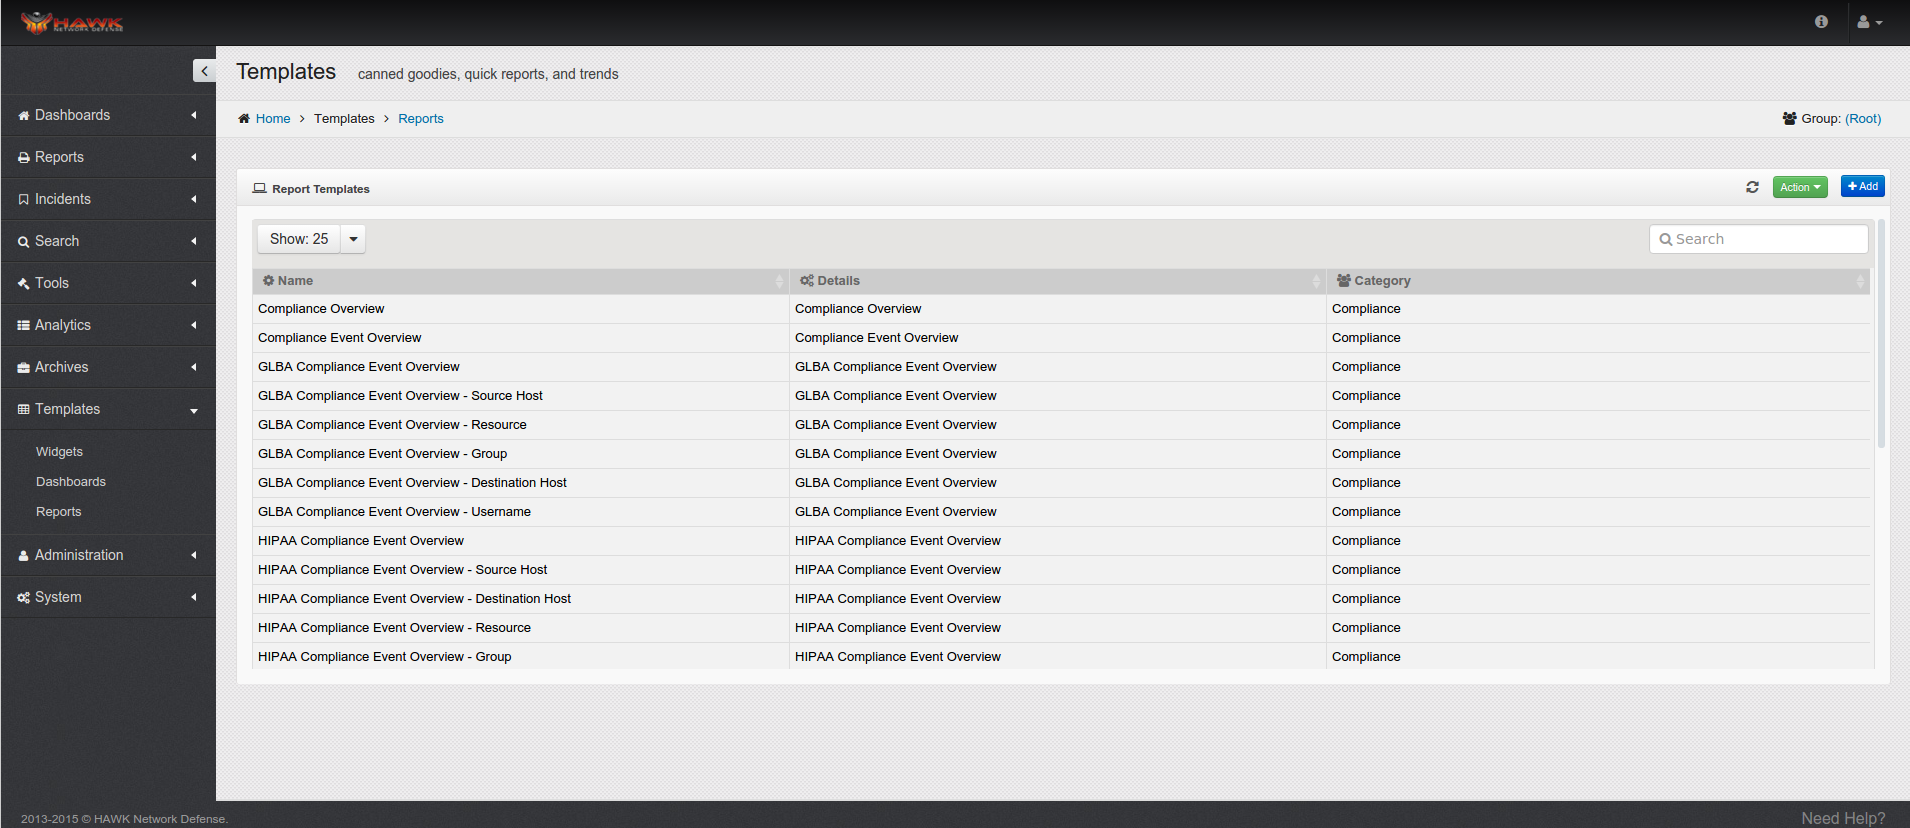
There are a variety of Templates defined that are available for use any time. However, there are oftentimes a need to create a new Dashboard Template. Follow these steps to view the Templates section for Dashboards.
On the navigation panel, click on .
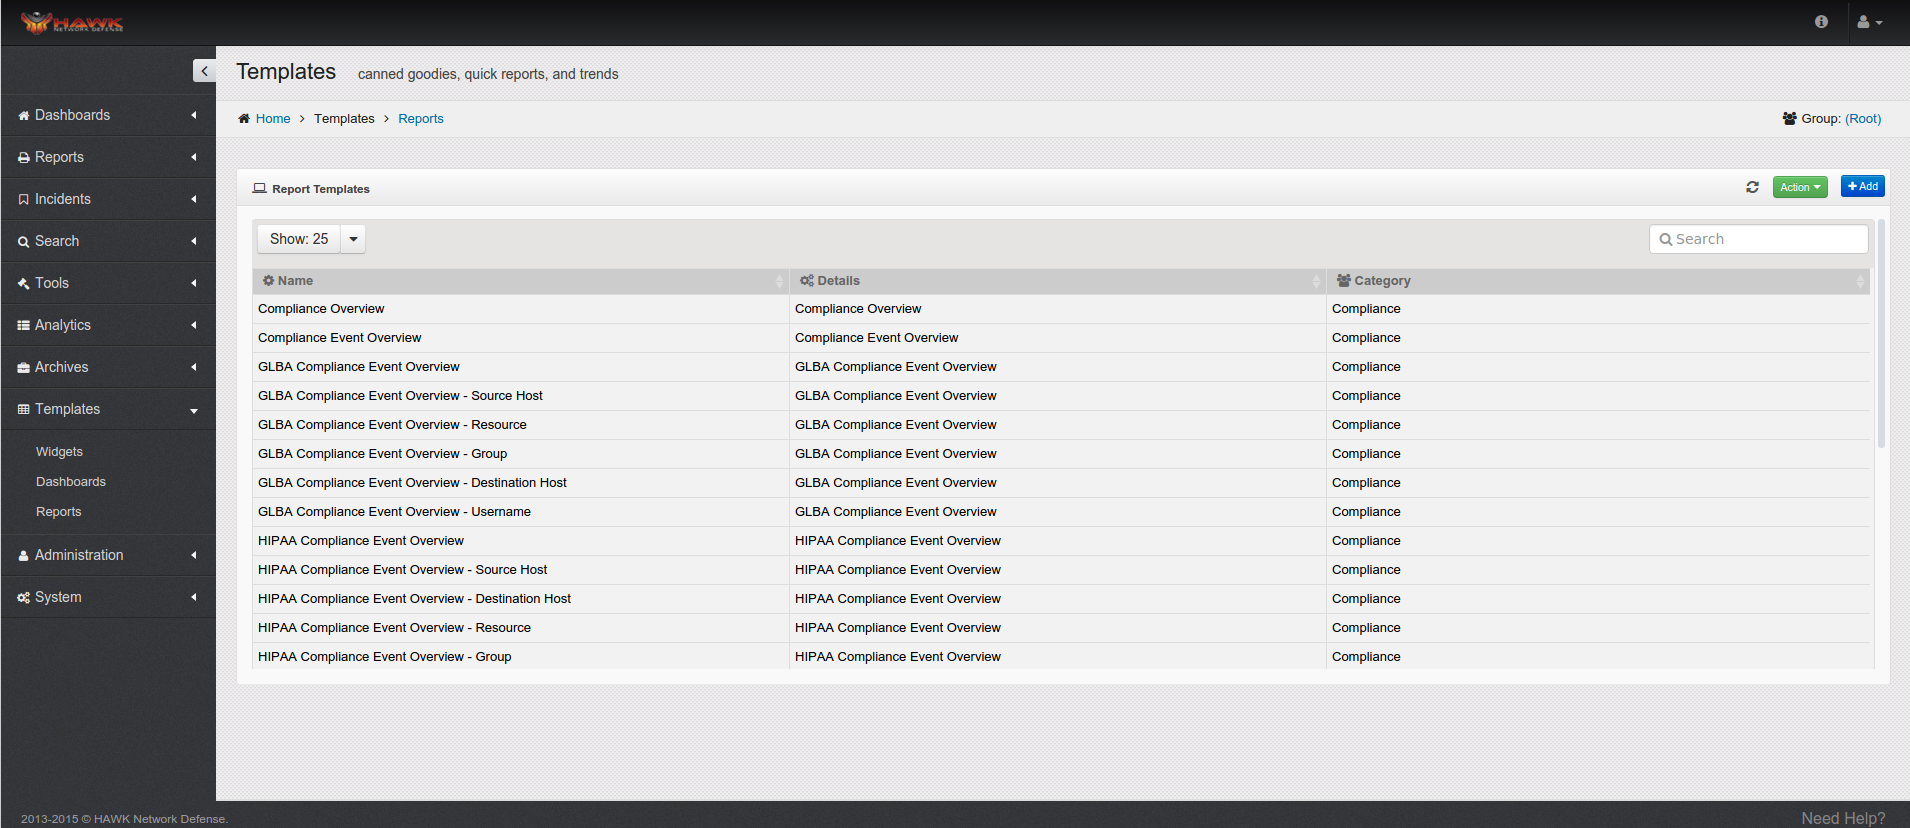
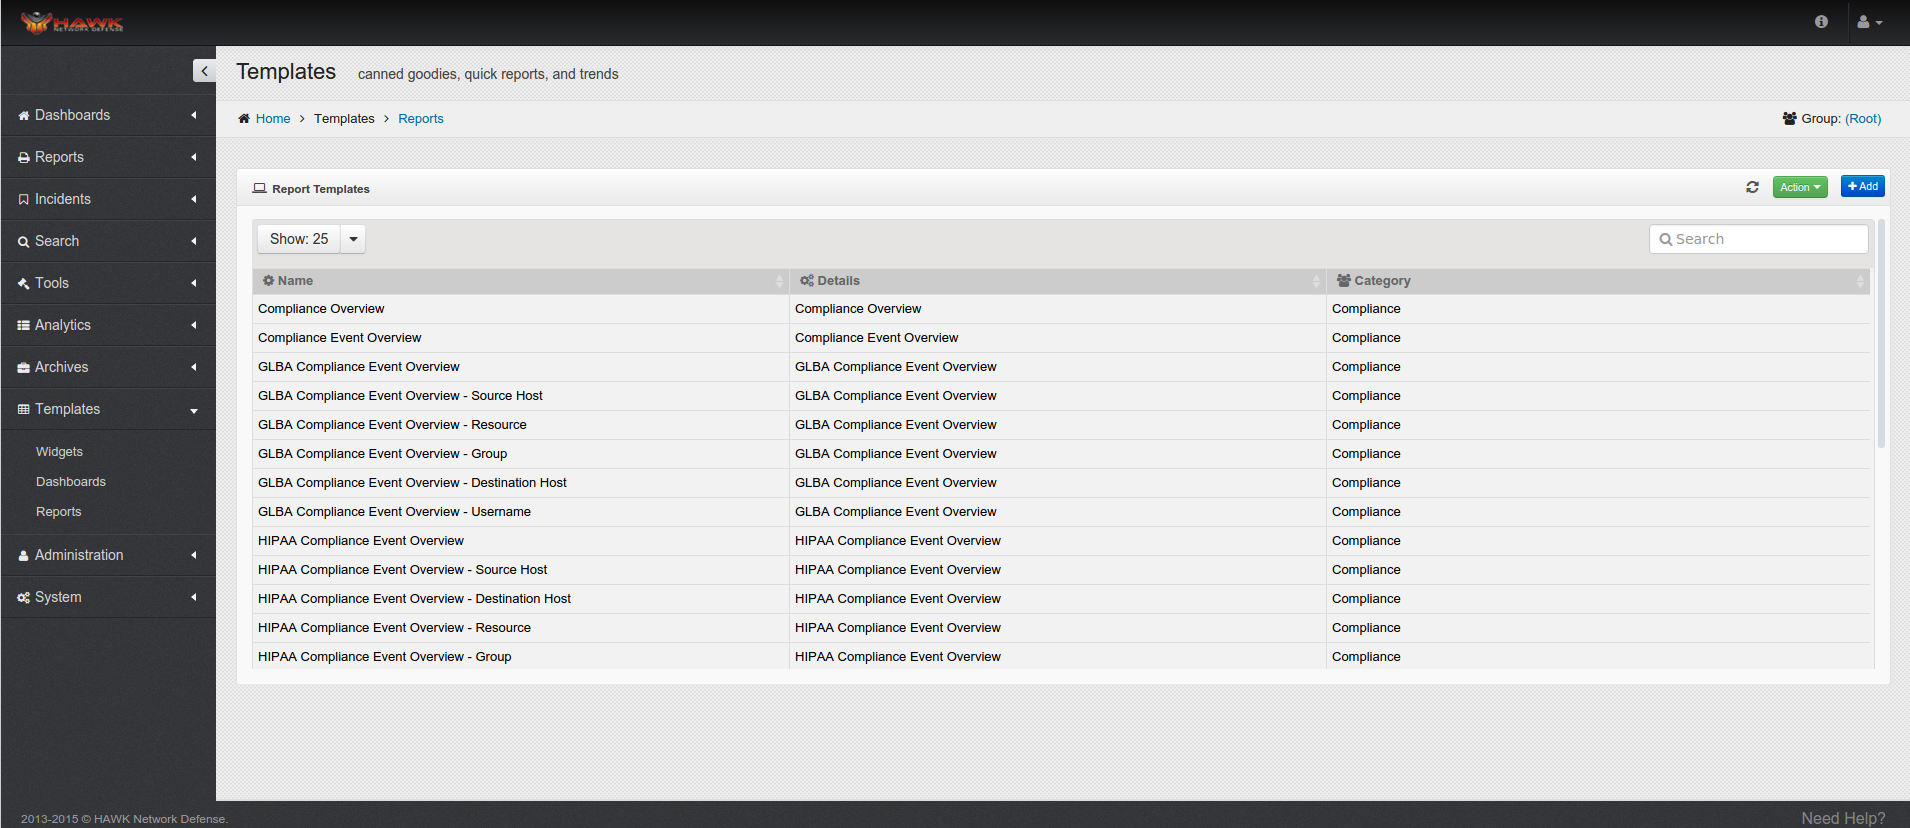
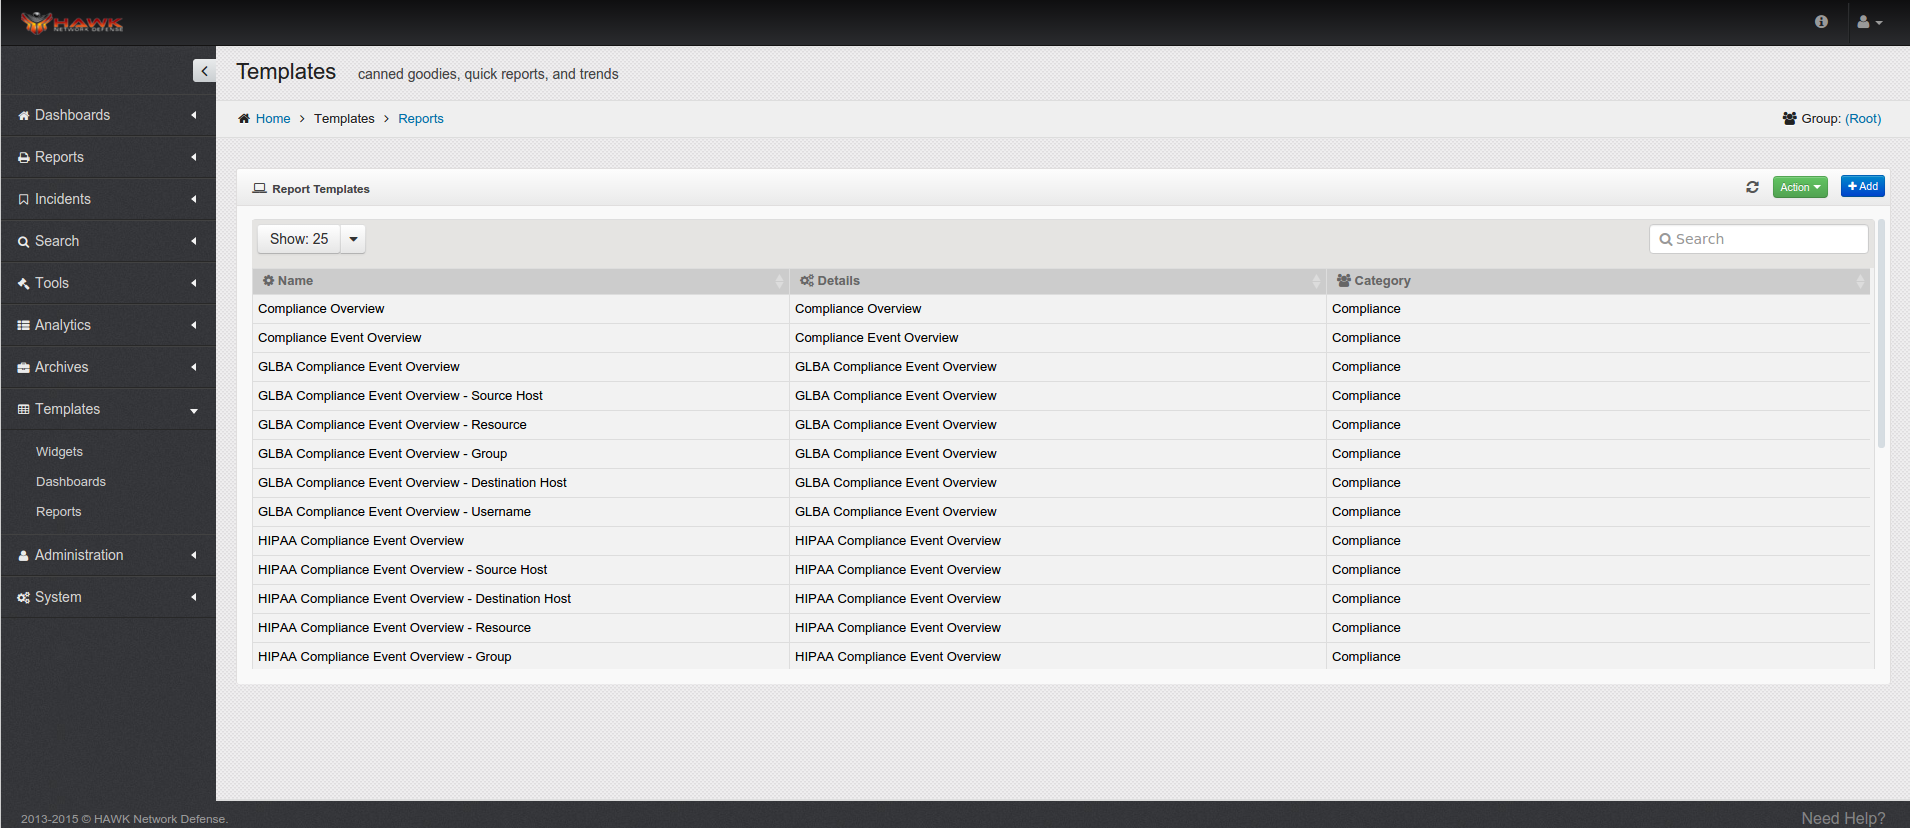
The Report Templates Dashboard window opens.
A list of the existing Dashboard templates are shown with the following information:
Name - Name of the Report Template
Details - Details of the Report Template
Category - Category the Report Template belongs to.
4.11. Creating a New Report Template
In order to create a Template that can be used for new Report, this section describes the steps to create a Template for a Report.
On the navigation panel, click on .
The Report Templates Dashboard window opens.
To create a new Report Template, click on the button.
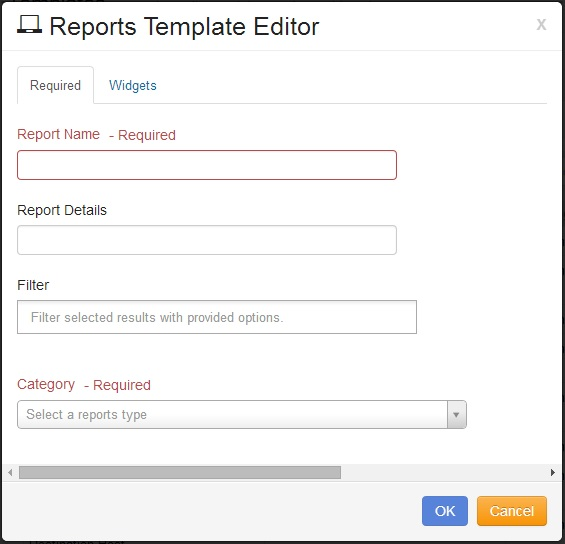
The Reports Template Editor window opens.
The first step is to enter the name of the Report in the Report Name field.
The next step is to add some details that further describes the purpose of the report in the Report Details field.
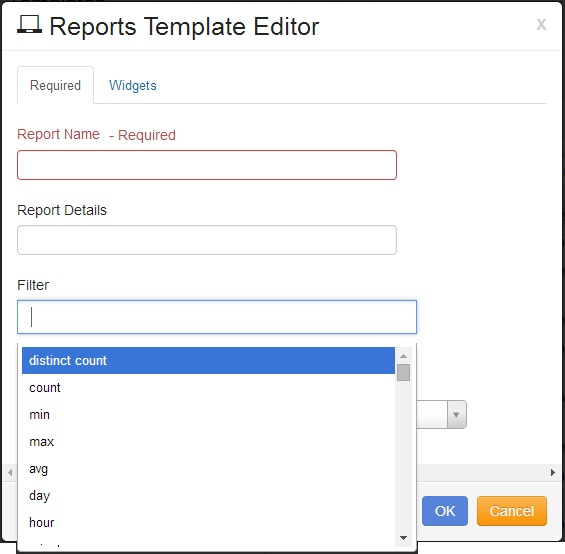
The next steps is to select the filter by clicking on the Filter field and selecting the desired filter.
The full list of selections for the Filter is shown in the reference guide.
A sample of the filters available include:
Distinct Count
Count
Minimum
Maximum
Average
Day
Hour
Note
Filter is an optional field.
The next section to select is the Category field.
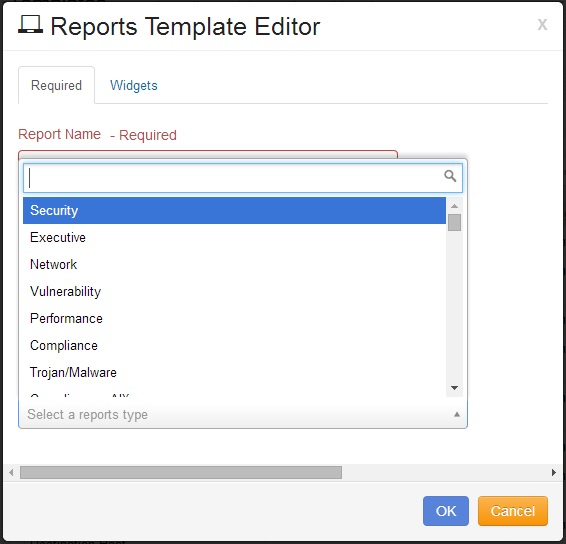
To select the Category, click on the Category field, and select the desired Category.
- Types of Categories include:
Security
Vulnerability
Trojan/Malware
Network
Security
Compliance
Click on the “Widgets” tab.
To add a new Widget, click on button. The Widget Editor window opens:
To use a Widget template select it from the drop down list, otherwise continue to the next step.
Enter the Widget Name.
Enter the Widget Details that better describes the data contained in the Widget.
The next item to define for the Widget is the Widget Type, which identifies the manner in which the data is displayed on the Dashboard. There are several Widget Types available, including:
Bar Graph
Group Bar Graph
Pie/Circle Graph
Timeline Graph
Map
Table
Trending (small) Portlet
Trending (Large) Portlet
Node-Link Relationship
Note
If you select Table X-Axis and Y-Axis do not appear. All other graph types will show the X-Axis and Y-Axis options.
The next criteria to define for the Widget is the Data Resource.
Click on the drop-down arrow by Data Resource to select the desired resource. The options include:
Events
Resource
Incidents
Vulnerabilities
Audit
Click on the “Advanced” tab.
Click on the field for Columns, and click on the desired columns.
The next step is to select the Filter for the Widget. (i.e. weight >= ‘9’)
The next step is to identify how the data on the Widget is grouped. Select an available column.
Note
After selecting a Group by column it is required to add a Aggregation column above in the Columns section. For example, If you want to group by ‘alert_name’ you will need to add a Aggregation column ‘count alert_name’.
The next step is to identify how the data will be sorted. Click on the Sort field and select the column on which the data is sorted.
The next step is to enter the limit the number of results that are returned in the Limit field.
Note
An offset can be entered into the Limit field, which specifies the number of records the system can skip before returning results. For example, ‘10,100’ indicates that it only returns records between the 10th and 100th records.
Once the items in the “Advanced” tab are identified, the labels for the X-Axis and Y-Axis can be defined.
Click on the “Settings” tab and click on the Widget Label (Y-Axis) to be used for the Y-Axis.
Next, click on the Widget Label (X-Axis) to be used for the X-Axis.
Click on the button to save the new Widget, or click on the button to discard the new Widget.
Next step is to either create more Widgets or modify the existing Widgets by repeating steps 10 through 24.
Final step is to click on the button to save the new Report Template, or click on the button to discard the new Report Template.
4.12. Exporting a Reports Template
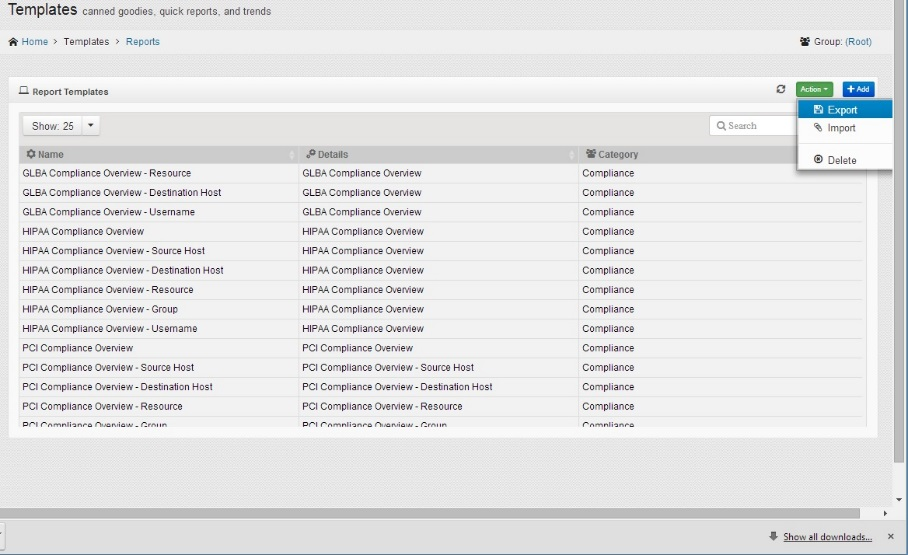
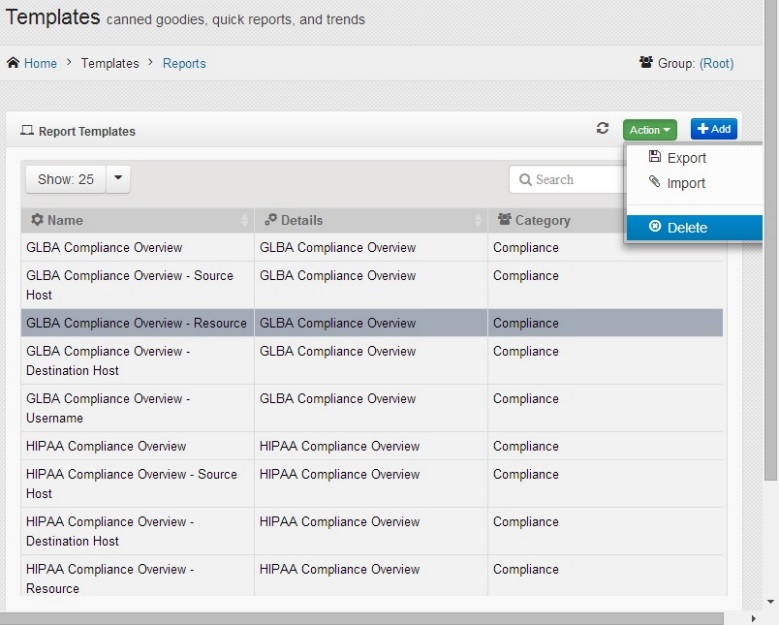
If the Reports templates needs to be exported to a CSV file, follow these steps:
On the navigation panel, click on .
The Report Templates Dashboard window opens.
Click on one or more of the Templates to Export.
Click on the button.
Select the destination for the Report Template to be exported to and click on the “Save” button.
The Report Template is now exported to the destination file.
4.13. Importing a Reports Template
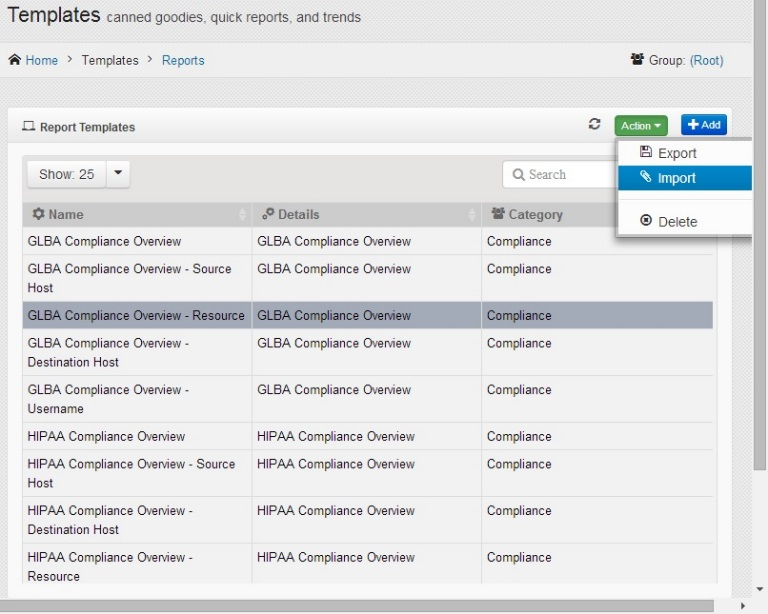
If the Reports Template needs to be imported, follow these steps:
On the navigation panel, click on .
The Report Templates Dashboard window opens.
Navigate to the desired Group to import into.
Click on the button.
The “Choose File to Upload” window opens.
Click on the file to import.
Click on the “Open” button.
The Selected file is imported.
4.14. Deleting a Report Template
If a Report Template needs to be deleted, follow these steps:
On the navigation panel, click on .
The Report Templates Dashboard window opens.
Click on one or more Report Templates to remove.
Click on the button.
A confirmation dialog box opens to confirm that the correct Report Template was selected to be deleted. Click on the “Yes” button to confirm the delete, or click on the “No” button to cancel the delete action.
Warning
Any modifications to the Templates cannot be “UnDone”. To correct modifications in error, the Template must be either recreated or edited.
